


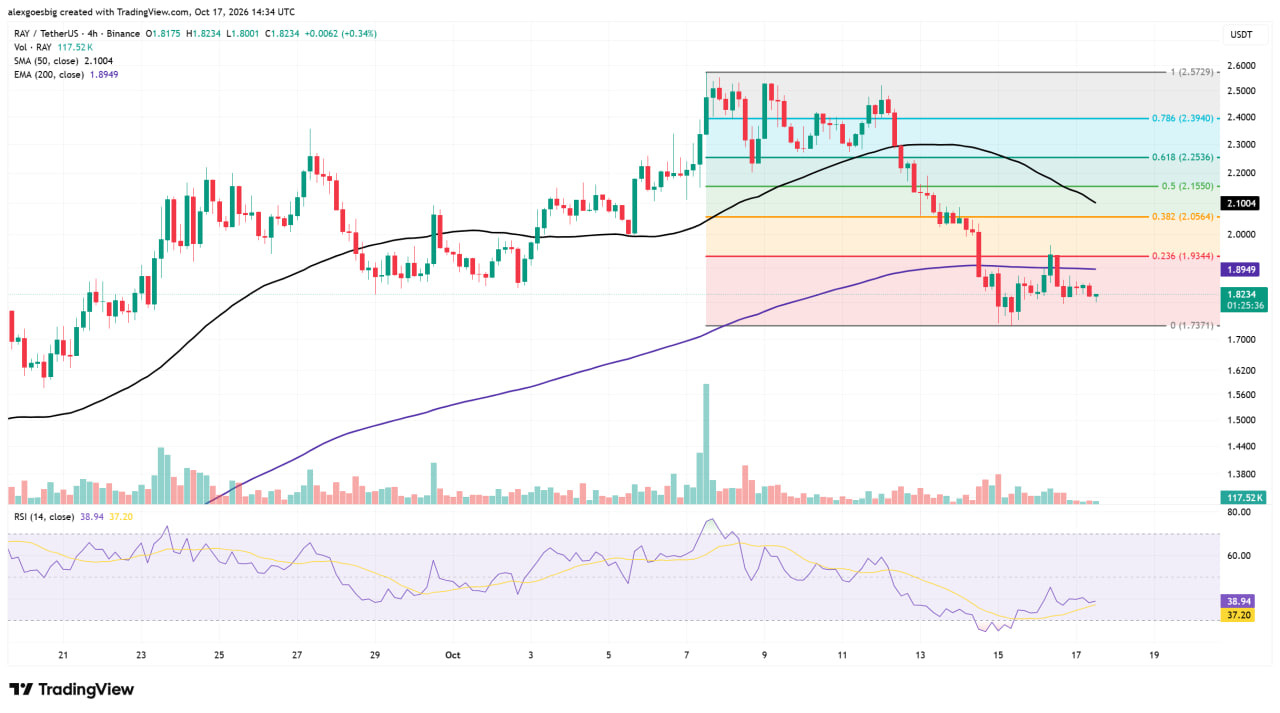
- $RAY failed to reclaim its 200-period moving average on the 4-hour chart.
- Raydium’s quarterly trading fees more than tripled on launchpad and tokenized-stock activity.
- Buybacks absorbed a noticeable share of $RAY’s circulating supply during the quarter.
- Early October data shows protocol activity cooling after an exceptionally strong September.
The $RAY price is down 23.7% over the past seven days and sits around $1.82, even though Raydium, the Solana-based decentralized exchange behind the token, has just closed its strongest fee quarter in a year. Data compiled by Pine Analytics shows Raydium collected $57.1 million in trading fees in Q3 2026 and directed about $6.2 million of that into $RAY buybacks, yet the token now sits below its EMA 200 on the 4-hour chart after a failed attempt to recover it on Oct 16. With a market capitalization of $489.7 million, $RAY is caught between a fundamental story that improved sharply over the summer and a chart that still belongs to the sellers.
What Tripled Raydium’s Fees
The headline figure hides an unusual detail, since adjusted trading volume rose only 17% quarter-over-quarter to $16.1 billion, while fees more than tripled, which means Raydium earned far more on every dollar that passed through its pools. A rough calculation from the reported numbers puts the effective fee rate at about 0.35% of volume in Q3, compared with something below 0.14% in Q2, a shift that points to a different mix of traders and pools.
