Dogecoin has fallen back to one of the most important technical levels on its long-term chart, with price now sitting directly on a multi-year support.
According to an analysis from Cryptollica, this support trendline has guided the asset’s market structure since 2021. Recent downward price action has now seen Dogecoin ($DOGE) once again testing this zone, which aligns with the lower boundary of a multi-year ascending channel.
While sentiment around the meme coin and the broader crypto market remains cautious, the Sunday analysis suggests the current zone could mark a turning point for $DOGE, potentially setting it up for the next phase of the market cycle.
Dogecoin at Five-Year Support
An accompanying chart highlights a rising “bottom line” that has remained intact for more than five years. Since the explosive rally in early February 2021 that pushed Dogecoin from $0.037 to a high of $0.088, every major correction has eventually found support near this trendline.
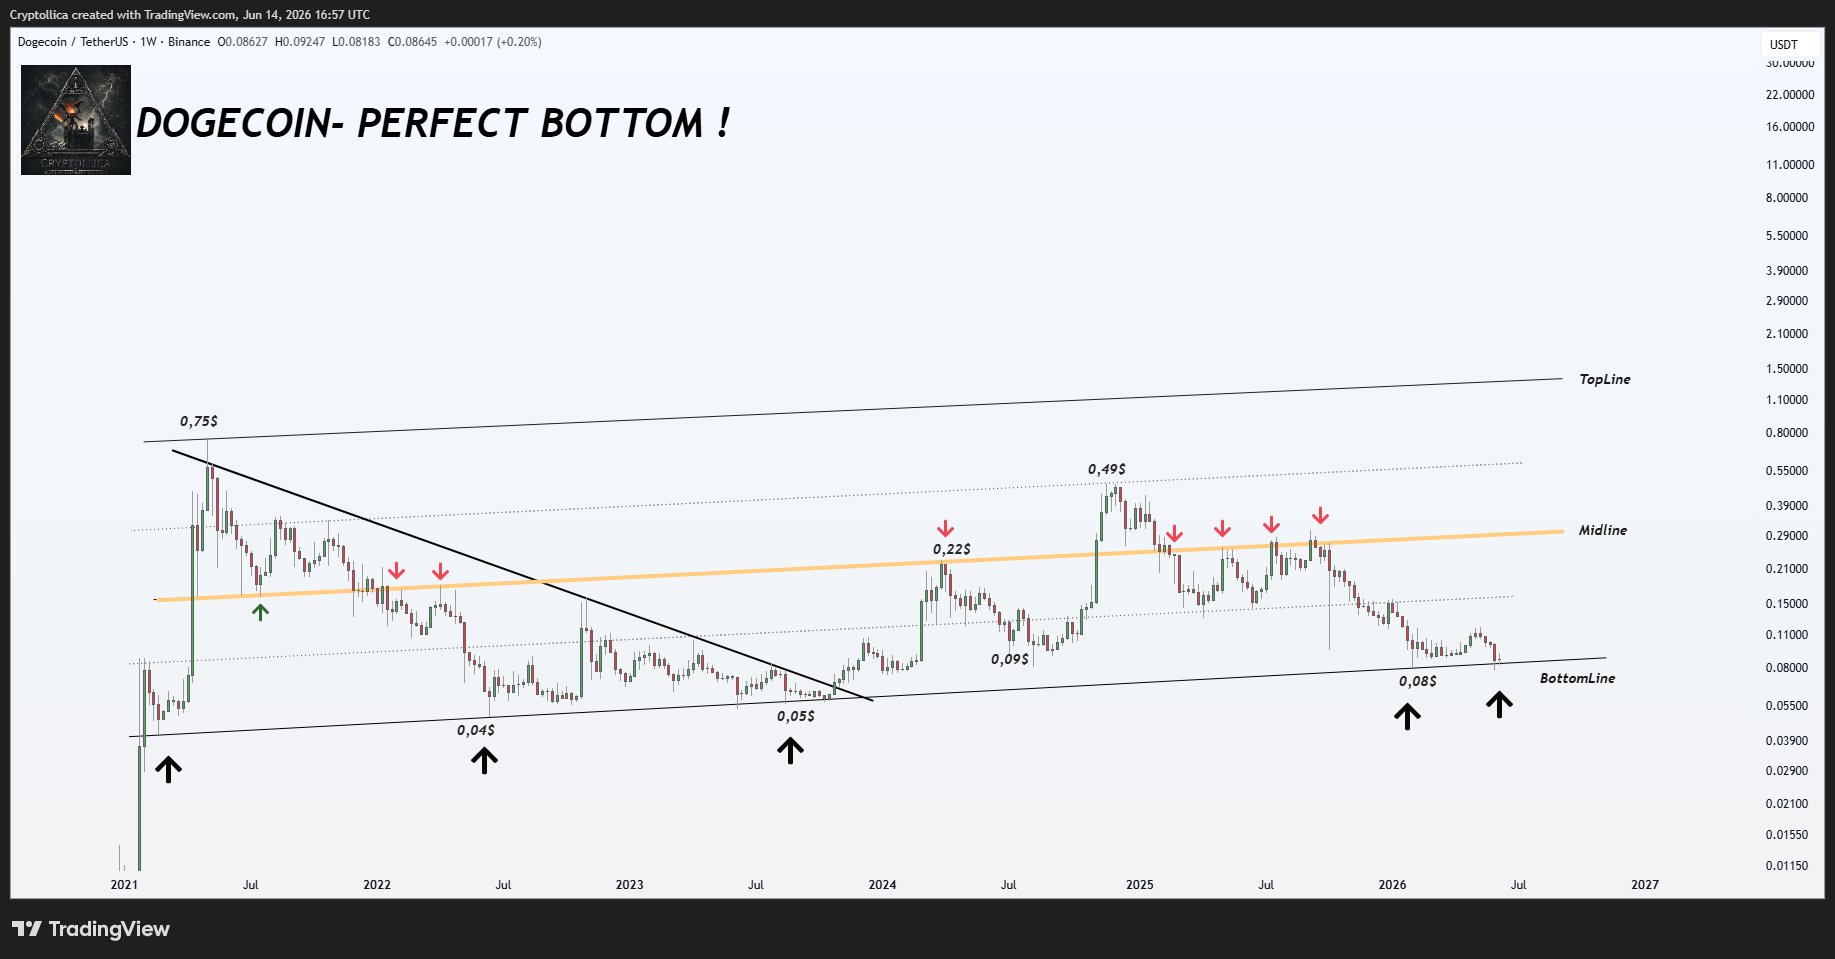
For context, in June 2022, $DOGE declined to a low of $0.049 before recovering. This aligned perfectly with the channel’s lower support line. A similar retest occurred in August 2023 when the token’s price briefly touched the area around $0.057. Both instances marked important turning points that preceded renewed upward momentum.
The last retest that brought $DOGE close to this key support was during the February market crash. Joining a broader market trend, the meme coin dropped to $0.080 but found support around the rising trendline.
Now, the current wave of downward price action has brought Dogecoin back toward the same structural support, with its price hovering near $0.088.
Cryptollica’s analysis suggests that the repeated reactions at this level strengthen its importance from a technical perspective. $DOGE has continued to respect this trendline despite several years of market volatility, with each revisit attracting enough demand to prevent a deeper correction.
As such, the commentator suggests that a “Dogecoin perfect bottom” might be forming as in previous cases, potentially targeting a price reversal to higher resistance levels.
Major Resistance Levels to Watch Should $DOGE Rebound
Although support has held historically, Dogecoin has also faced significant resistance above. Should it find support at the current “bottom line,” $DOGE needs to reclaim key resistance levels before any significant recovery can take shape.
Meanwhile, the chart identifies some of them, including the resistance line at $0.15. The token peaked around this level in January before continuing its sideways trend in the following months.
After this is a mid-channel resistance zone that repeatedly rejected higher prices in 2025. Several failed breakout attempts occurred near the $0.26 to $0.30 region between February and September 2025, with $DOGE eventually losing upward momentum. Before any sustained recovery can develop, the token would likely need to reclaim the channel midpoint and establish support above it.
Ultimately, a sustained rebound could push Dogecoin to the upper boundary of the ascending channel. The last time it visited this zone was in 2021 when it peaked at $0.74. According to the chart, reclaiming this trendline will see the leading meme coin finally surpass the $1 mark to around $1.50. This would mark a new all-time high for $DOGE and represent a 1,604% growth from the current market price.
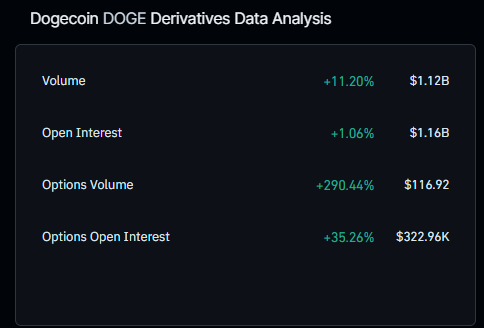
In the meantime, market activity seems to be picking up again, with trading volume increasing 31% in the last 24 hours to $663 million. Open interest has also increased slightly during the same period to $1.16 billion, signaling returning derivative interest.