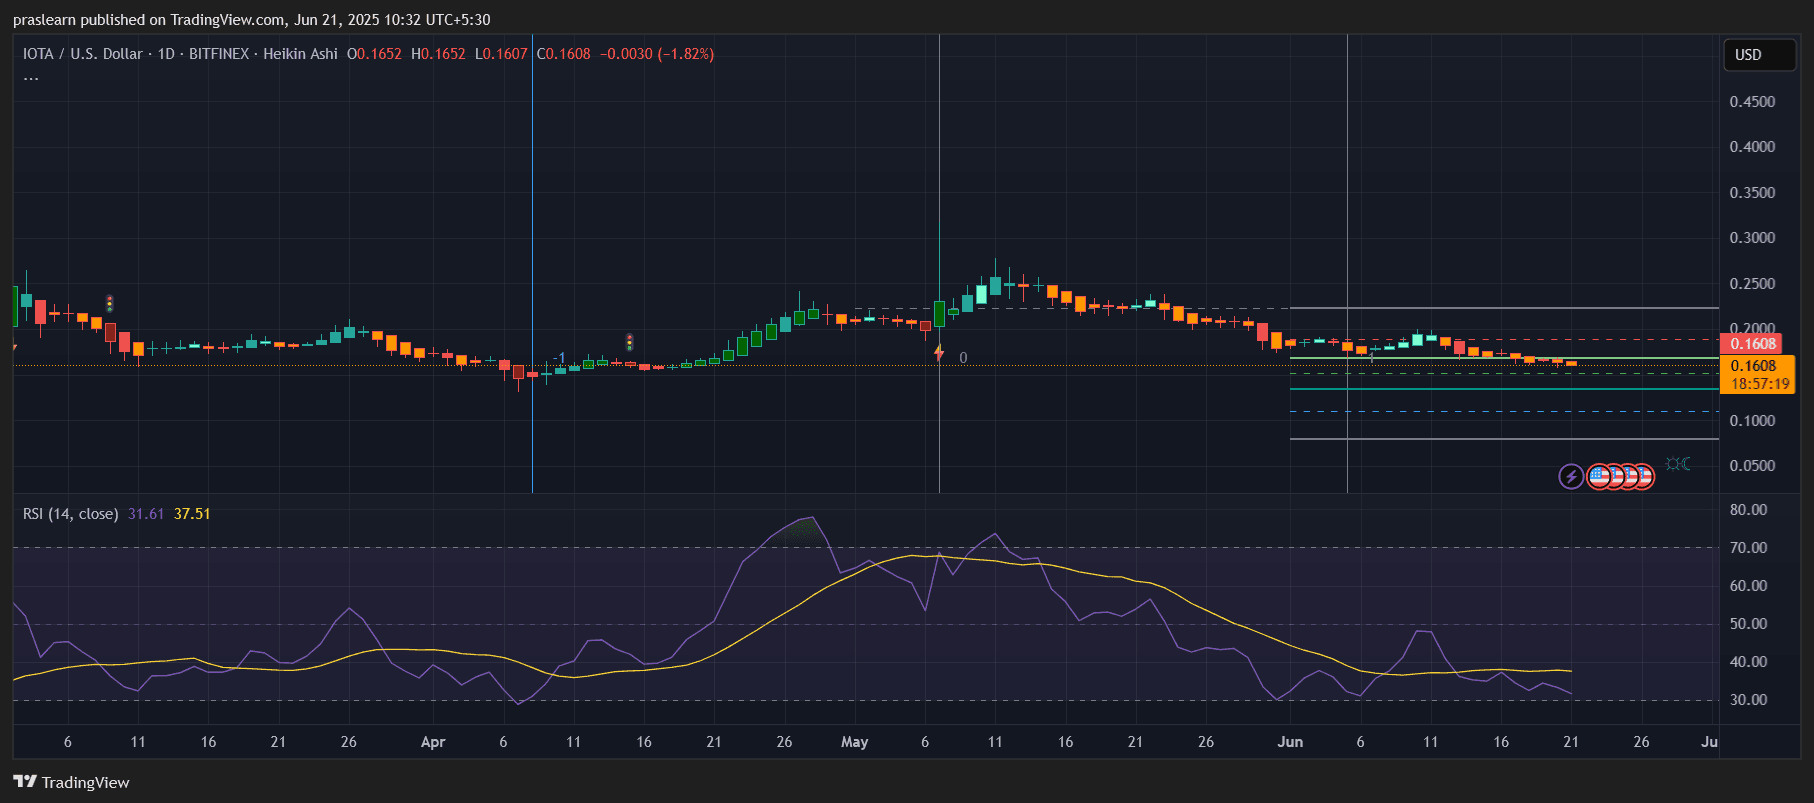
IOTA, once hailed for its feeless transaction model and unique Tangle architecture, is now under pressure again. As of June 21, 2025, IOTA price is trading at $0.1608 — close to a major support zone — after weeks of steady decline. The daily chart paints a grim picture for bullish traders unless key levels hold. In this analysis, we explore what the technical indicators reveal, the critical support-resistance areas, and what to expect next based on chart-derived probabilities for IOTA Price Prediction. The Relative Strength Index (RSI) currently sits at 31.61, just above the 30-mark that typically signals an oversold condition. For context, the last time RSI dipped below 30 was in early April, followed by a 38% rally in the following 15 days. If history repeats, IOTA price might soon witness a technical bounce. However, this alone doesn’t confirm a bullish reversal, especially with broader weakness still evident. Looking at the Fibonacci retracement plotted from the recent swing low ($0.1200) to swing high ($0.2550), IOTA price is hovering near the 0.786 retracement level, which sits around $0.1600. This is a critical line in the sand for bulls. A break below this level could expose the next key support at $0.1450, followed by $0.1200 — the year’s low. Let’s do the math: On the upside, immediate resistance lies around $0.1800, which aligns with the 0.618 Fib level. Beyond that, $0.2000 and $0.2150 act as stronger resistance zones based on prior candle bodies and wicks. If buyers reclaim momentum, a rally toward $0.2000 could offer a 24.4% gain from current levels. But the candle structure doesn't show strong bullish Heikin Ashi formations yet. Most recent candles have long bodies with no upper wicks, showing continuous selling pressure. The chart clearly shows a rounded top pattern that began forming in late May, with a steady transition from bullish green candles to a stream of red. The trend has remained consistently bearish with no higher highs or higher lows in recent sessions. For a bullish reversal, IOTA price must close above $0.1800 on strong volume, forming a higher low to break the bearish structure. If $0.1600 fails as support, IOTA could test $0.1450 or even $0.1200 quickly. On the contrary, if RSI bounces off the oversold region and bulls manage a recovery, we could see a test of $0.1800 and possibly $0.2000. Forecast Summary: IOTA is at a critical juncture. While RSI suggests a bounce may be near, price action remains in a clear downtrend. Traders should watch the $0.1600 level closely. A breakdown here could bring deeper losses, while a bounce backed by volume might offer short-term gains. For long-term holders, this zone may be a strategic accumulation point — but with tight stop losses in place. If you’re planning to buy IOTA, Bitget is a solid exchange to consider. Here’s why it stands out: Follow these simple steps to buy IOTA on Bitget and kickstart your crypto journey: 1. Open an Account 2. Complete KYC Verification 3. Fund Your Account 4. Go to the Trading Section 5. Swap to IOTA $IOTA, $IOTAPriceIOTA Price Prediction: Is IOTA Nearing Oversold Territory?
Support Zones: Will $0.15 Hold?
If IOTA drops from $0.1608 to $0.1450, that’s a potential 9.8% downside. If it slips to $0.1200, the decline widens to 25.38%:Resistance Levels: What’s the Recovery Path?
Chart Structure and Trend Analysis
IOTA Price Prediction: What to Expect in the Next 7–14 Days?
Where to Buy IOTA Coin?
Easy Guide: How to Buy IOTA on Bitget?
Sign up on Bitget using this referral link to claim a welcome bonus:
https://partner.bitget.com/bg/cryptoticker.
Submit your identity documents to complete the KYC process. This step is essential for secure and compliant trading.
Deposit funds using a variety of payment options like bank transfer, credit/debit card, or crypto deposits supported by Bitget.
Head to Bitget’s trading platform and search for the IOTA/USDT pair or simply type “IOTA” in the search bar.
Use your available funds to buy IOTA. Review the details and confirm the trade—your IOTA coins will be added to your account instantly.
Will IOTA Drop 25% or Bounce Back Strong?

IOTA/USD Daily Chart- TradingView
