
On Saturday morning, bitcoin’s price sits between $68,090 and $69,162 over the last hour, with a $1.36 trillion market cap, $97.38 billion in 24-hour volume, and a wide $66,131 to $71,604 intraday range, reflecting a market that has stopped panicking but hasn’t found conviction.
Bitcoin Chart Outlook
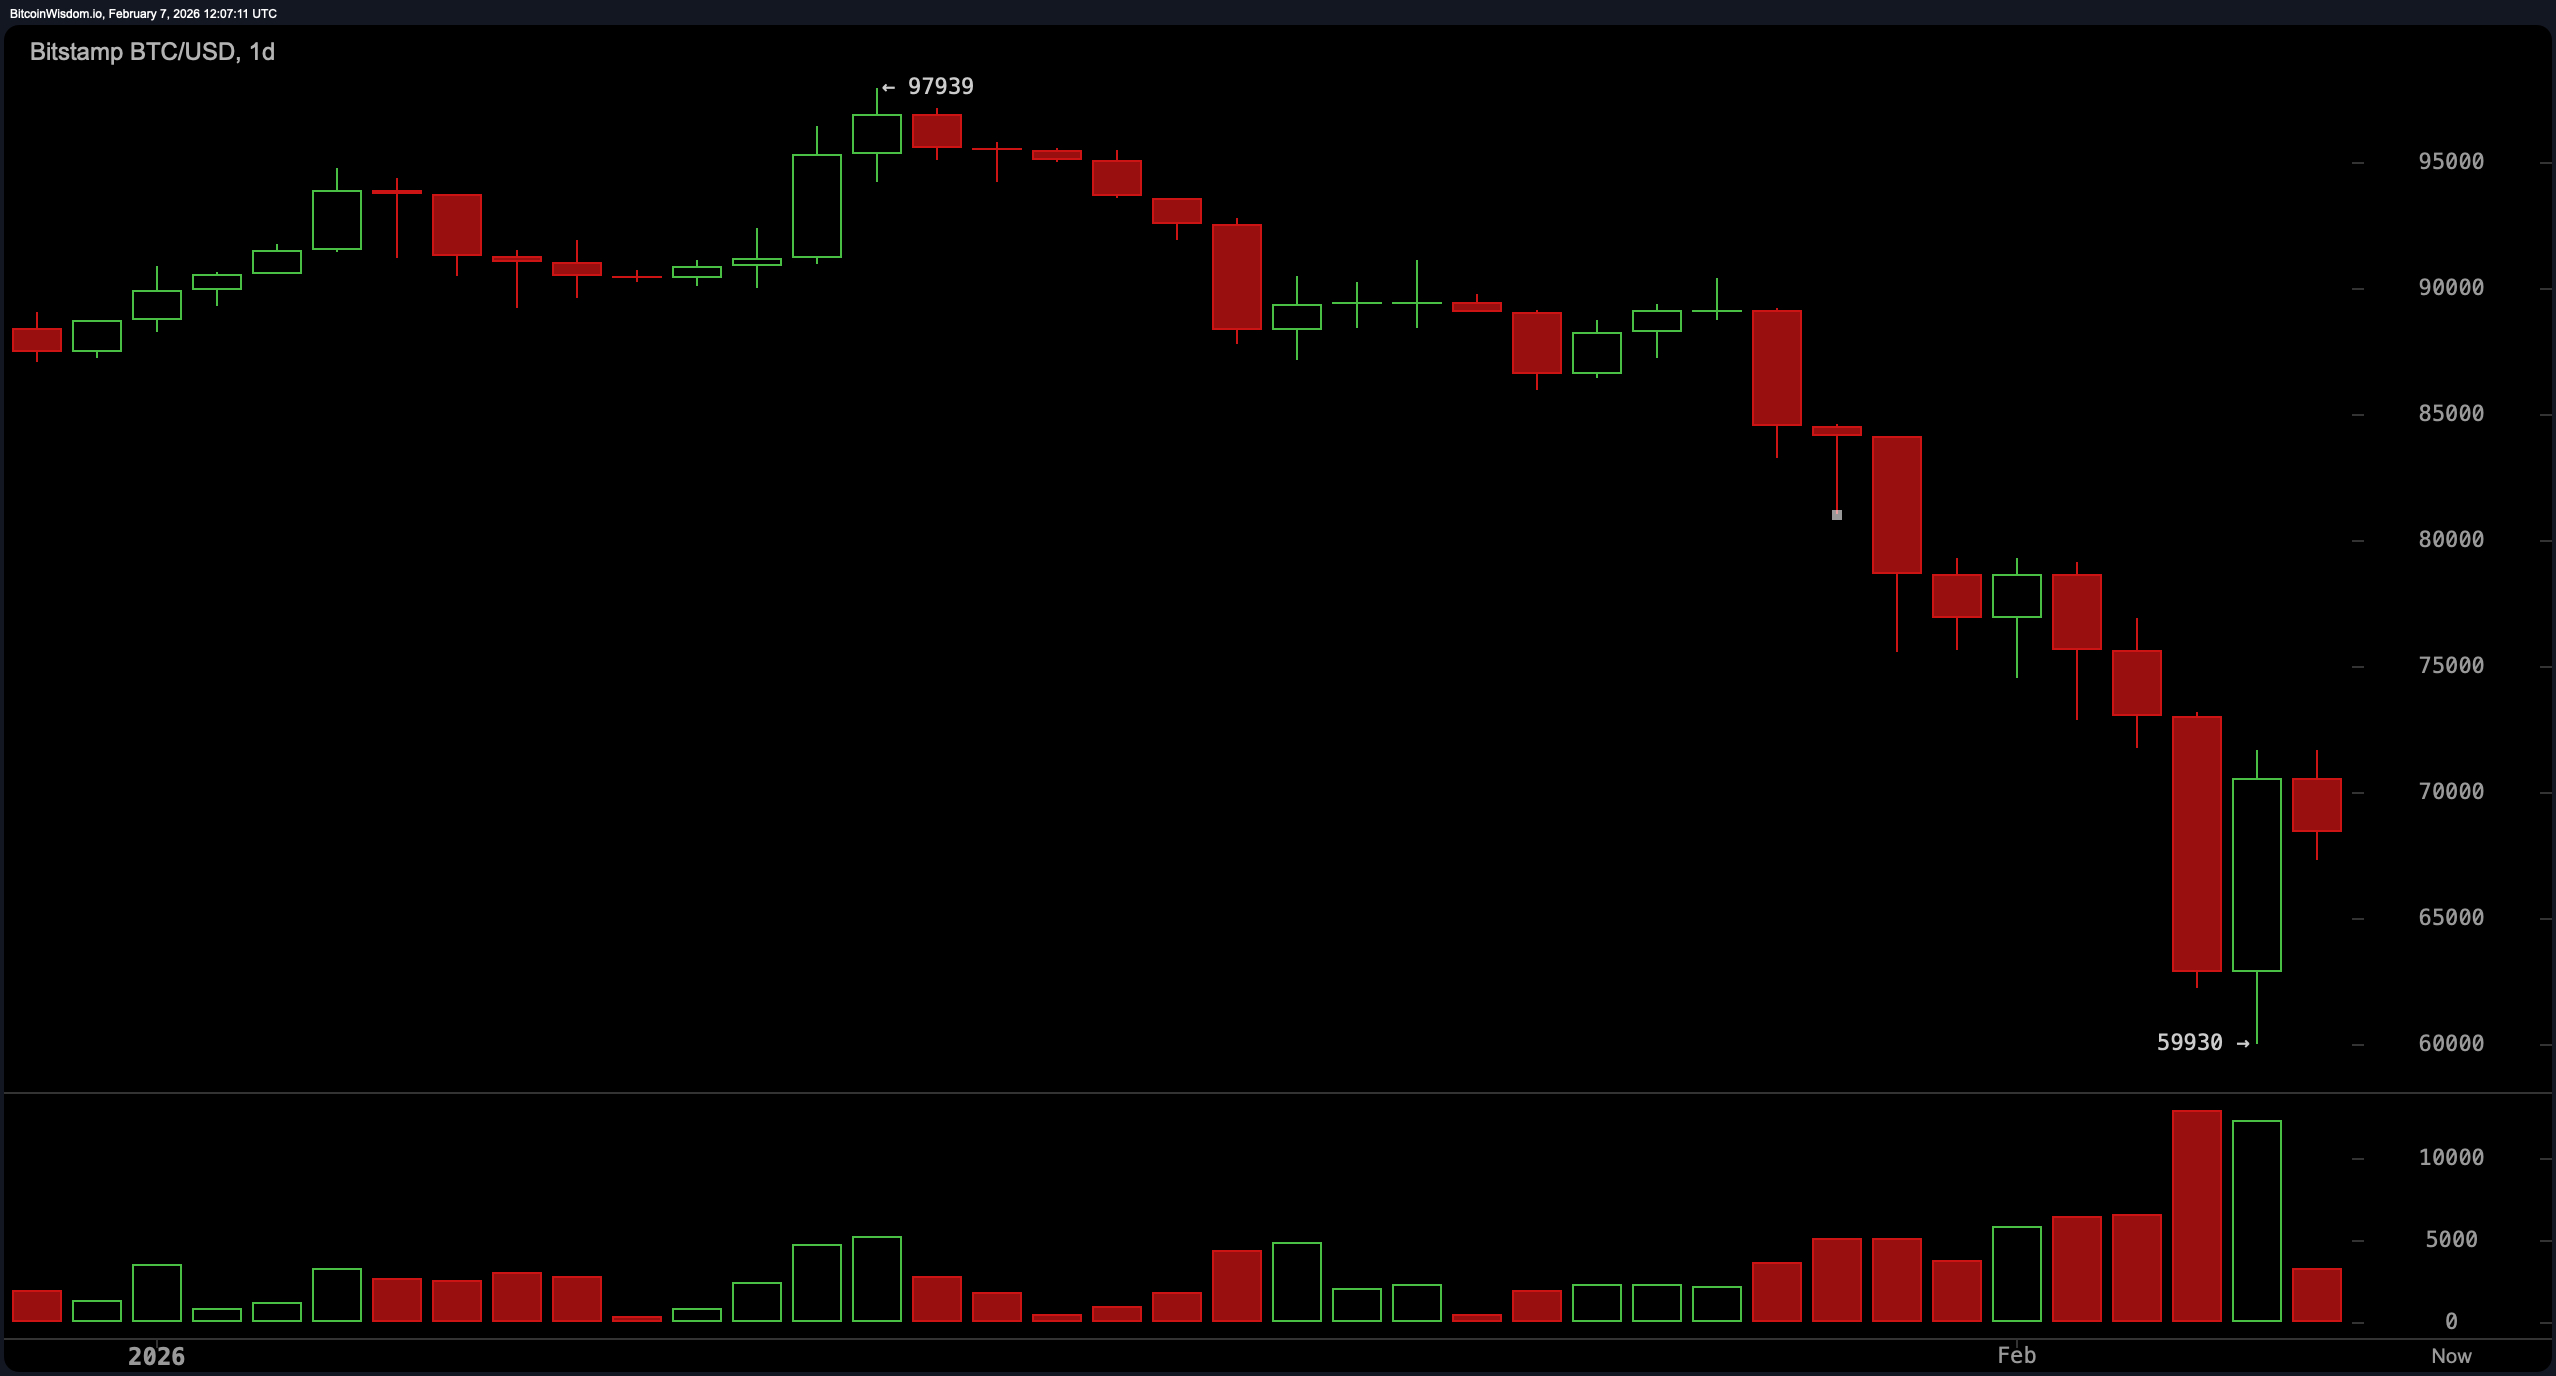
On the daily chart, bitcoin continues to respect a clearly defined downtrend that began after the failed push near the $97,900 peak and culminated in a sharp capitulation wick to $59,930. The subsequent rebound looks more like a reflex than a revival, with volume surging during the flush and fading on the bounce. That sequence typically signals panic followed by stabilization, not trend reversal. Until price can reclaim and sustain levels north of $75,000, the broader structure remains corrective, no matter how convincing the short-term enthusiasm tries to sound.
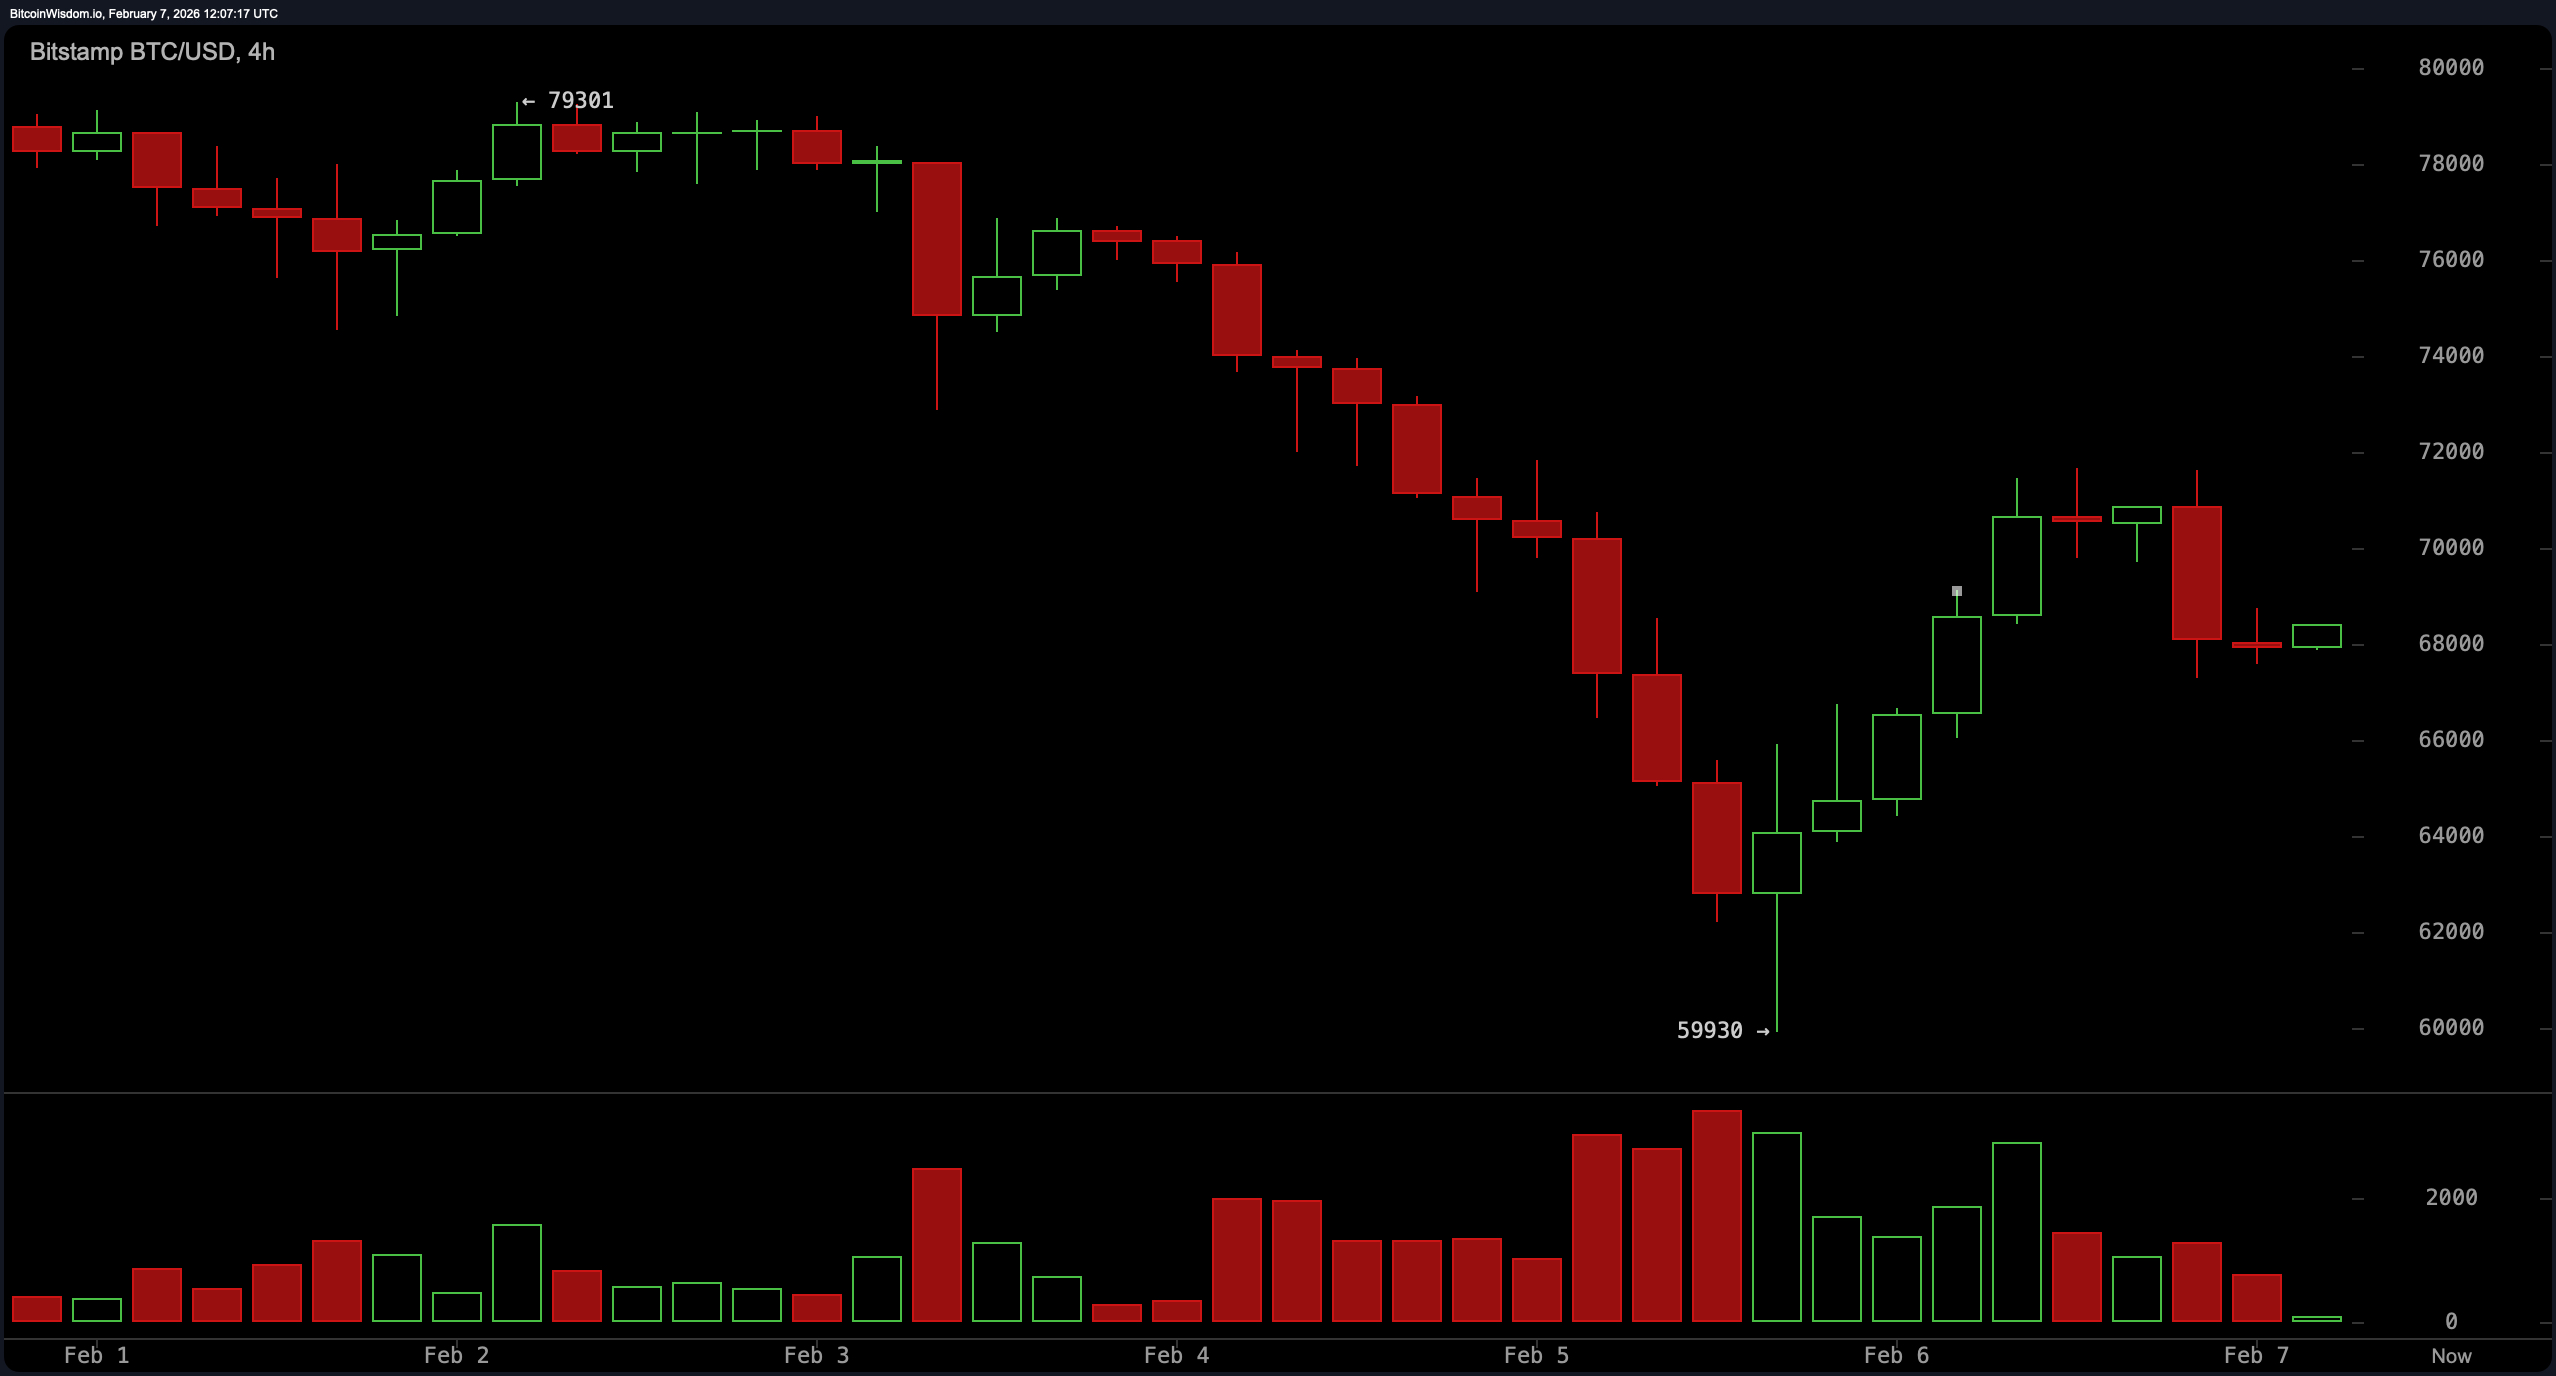
Zooming into the four-hour chart, the market shows a classic V-shaped recovery that lost steam right where it should have, in the $71,000 to $72,000 zone. Since then, price action has compressed into a range, with support forming near $66,000 to $67,000 and resistance repeatedly capping upside attempts. This range-bound behavior carries a bearish lean, as momentum has not followed through on the rebound. In other words, bitcoin climbed the stairs up and took the elevator back down, then decided to pace the hallway.
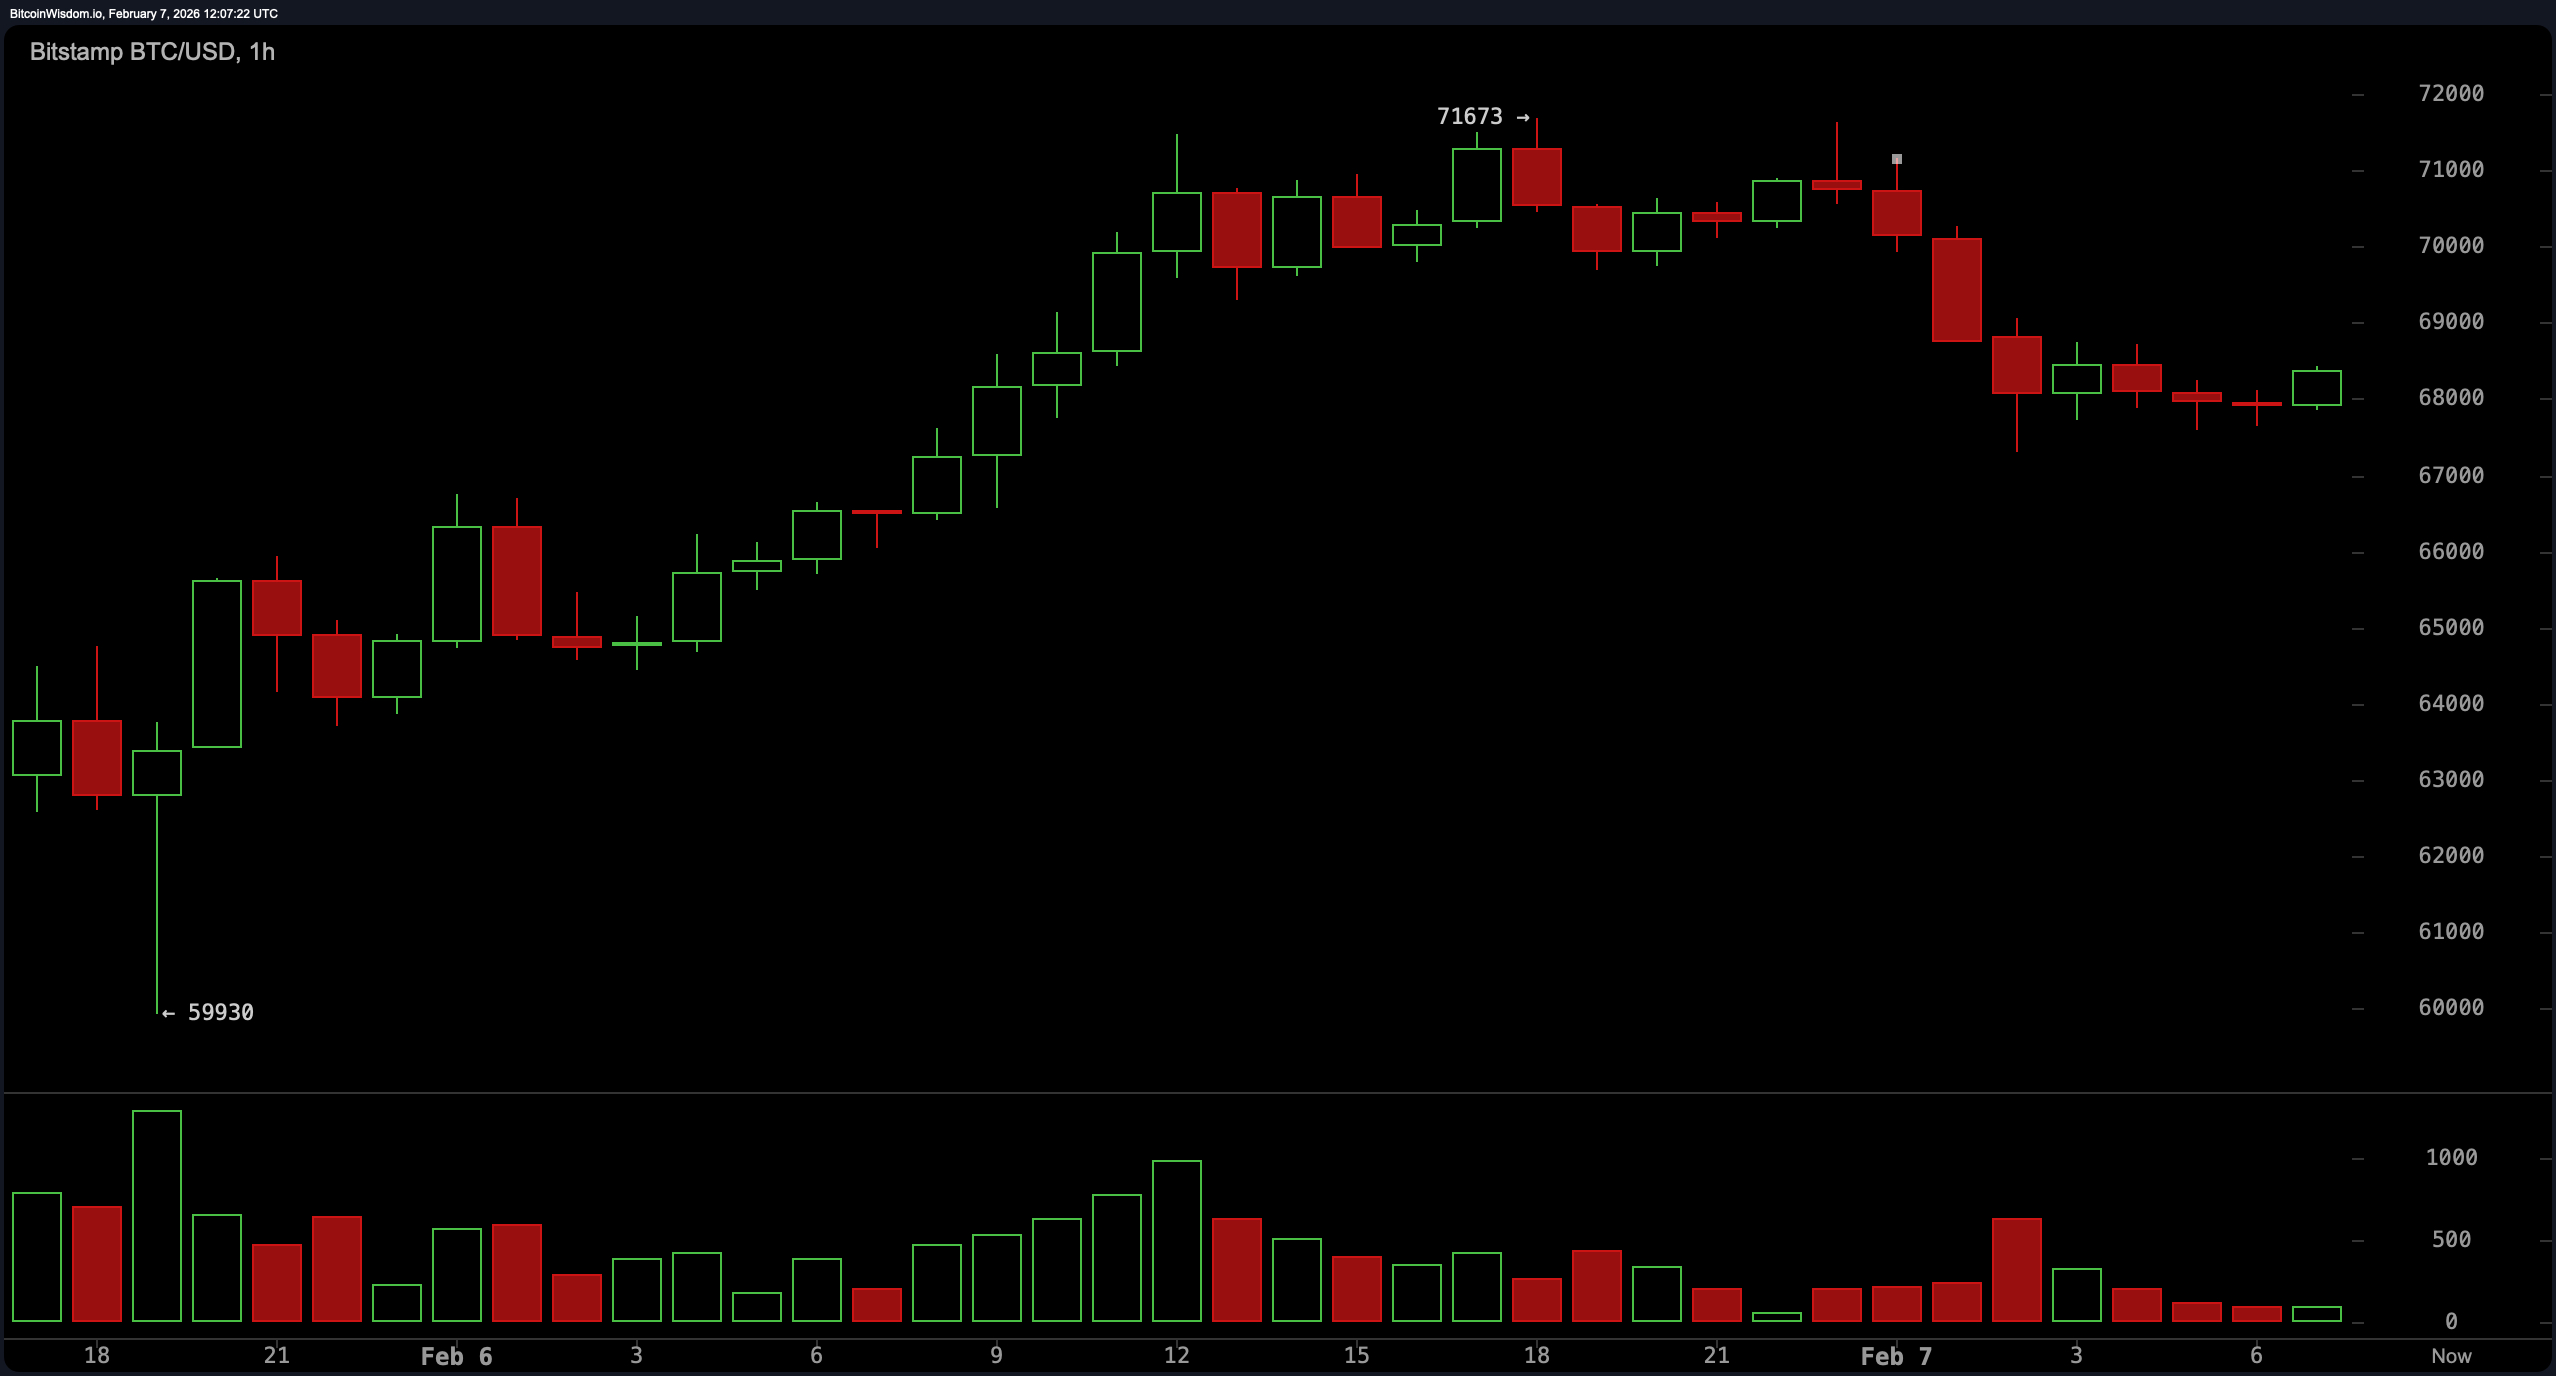
The one-hour chart sharpens that picture, showing a short-term uptrend from the capitulation low that stalled at $71,673 before rolling into lower highs. Price is now oscillating tightly around $68,000 to $69,000, a sign of intraday balance rather than conviction. Support rests near $67,500 to $68,000, while resistance looms between $70,500 and $71,700. This kind of compression often precedes expansion, and the lack of volume suggests traders are waiting, watching, and side-eyeing every tick.
Oscillators and moving averages are not exactly whispering sweet nothings. The relative strength index ( RSI) sits at 31, flirting with oversold territory without quite committing. Stochastic reads 21, while the commodity channel index (CCI) is deeply negative at −122. Average directional index (ADX) at 44 confirms trend strength, and both momentum and the moving average convergence divergence ( MACD) remain firmly negative.
Every major moving average, from the 10-period exponential moving average (EMA) through the 200-period simple moving average (SMA), is positioned well above the current price, a stacked ceiling that underscores how much technical repair work remains. Bitcoin may be resilient, but right now the charts are reminding everyone that resilience is not the same thing as immunity.
Bull Verdict:
A constructive case hinges on stabilization holding above the $66,000–$68,000 support band, where intraday balance has repeatedly formed, and selling pressure has failed to accelerate. The deeply compressed structure on the one-hour chart suggests a volatility expansion is brewing, and a sustained push through the $71,000–$72,000 resistance zone would improve short-term structure and hint that the recent capitulation low near $59,930 may have marked a meaningful exhaustion point rather than a pause.
Bear Verdict:
The dominant narrative remains defined by a daily downtrend, reinforced by uniformly bearish moving averages and negative momentum readings. Price is still trading well below every major trend gauge, with rallies stalling precisely at prior breakdown zones. Unless bitcoin can reclaim and hold above $75,000 on higher time frames, rebounds continue to look corrective, leaving the market vulnerable to renewed downside pressure should support near $66,000 give way.
FAQ ❓
- What is bitcoin’s price today?
Bitcoin is trading between $68,090 and $69,162 over the past hour, moving within a 24-hour range of $66,131 to $71,604 as volatility remains elevated. - Is bitcoin bullish or bearish right now?
Bitcoin remains technically bearish on the daily chart, with price trading below all major moving averages. - What levels matter most for bitcoin price action?
Key support sits near $66,000, while resistance is concentrated between $71,000 and $75,000. - What is driving bitcoin market sentiment today?
Market sentiment is shaped by heavy trading volume, weak momentum indicators, and consolidation following a recent capitulation move.
