
- The altcoin market cap rebounds near $887.55B as charts project possible upside toward $2.05T resistance.
- RSI bottoming patterns align with previous market cycles that triggered massive multi-month crypto rallies.
- Fibonacci targets at $1.35T, $1.65T, and $2.05T mark key resistance zones in the next potential bull phase.
The total market capitalization of altcoins is displaying a bullish formation after hitting crucial Fibonacci retracement zones. Data from TradingView shared by market analyst BACH on November 11 shows the altcoin market cap holding near $887.55 billion, with potential targets at $1.35 trillion, $1.65 trillion, and a projected $2.05 trillion resistance level. The analyst noted that past cycles with similar setups triggered major rallies across the crypto market.
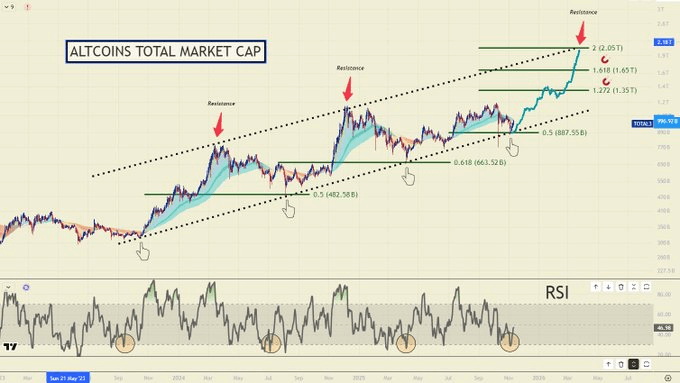
The chart outlines a rising parallel channel with clear resistance and support zones. Previous market peaks occurred at the upper boundary of this channel, each followed by deep corrections that retraced toward the 0.5 and 0.618 Fibonacci levels. The latest structure indicates a similar bottoming phase supported by a strong trendline rebound.
BACH’s commentary highlighted recurring market emotions—disbelief, fear, and RSI bottoming—each preceding substantial recoveries. According to the post, every past instance with this setup ended in a “massive crypto rally,” suggesting the market may again be nearing a strong expansion phase.
RSI Bottoming Pattern Mirrors Previous Bull Cycles
The relative strength index (RSI) on the chart reflects repeated bottoming signals, historically linked with sharp reversals in total crypto value. RSI readings have consistently bounced near oversold territories before major uptrends, forming cyclical lows that align with the lower trendline of the channel.
This RSI behavior coincides with investor sentiment cycles where fear dominates before large recoveries. The RSI indicator, currently around 46.9, mirrors levels observed before previous rallies in mid-2023 and early 2024. The chart also shows highlighted circles marking past RSI troughs that signaled accumulation phases leading to multi-month uptrends.
Analysts interpret these patterns as confirmation of a broad market cycle repetition. The total crypto capitalization, currently under $1 trillion, mirrors conditions seen before prior expansions that pushed valuations to new highs. This parallel strengthens the technical case for a sustained rally if RSI continues to recover above midline zones.
Fibonacci Projections Indicate Upside Targets Beyond $1.5T
The Fibonacci projections drawn on the chart indicate sequential resistance targets at 1.272 ($1.35T), 1.618 ($1.65T), and 2.0 ($2.05T). Each target aligns with prior breakout magnitudes observed in earlier bullish phases. Historically, altcoin rallies have accelerated once market capitalization broke above the 0.5 retracement level, confirming renewed investor confidence.
The upward projection suggests a potential 100% growth from current levels if the pattern repeats. Analysts also note that a breakout above the median channel line could trigger momentum-driven inflows, with market dominance shifting back to alternative assets. This setup positions the altcoin sector at a critical turning point, echoing the cyclical rhythm that historically preceded explosive market phases.
One question now shapes investor focus: Can the altcoin market sustain this rebound and reclaim the $2 trillion mark before 2026?
