
Bitcoin opened the Sept. 17 session at $116,276 with a total market capitalization of $2.31 trillion and a 24-hour trading volume of $43.10 billion. During the session, the price moved within an intraday range of $114,866 to $117,292, reflecting both bullish resilience and selling pressure at higher levels.
Bitcoin
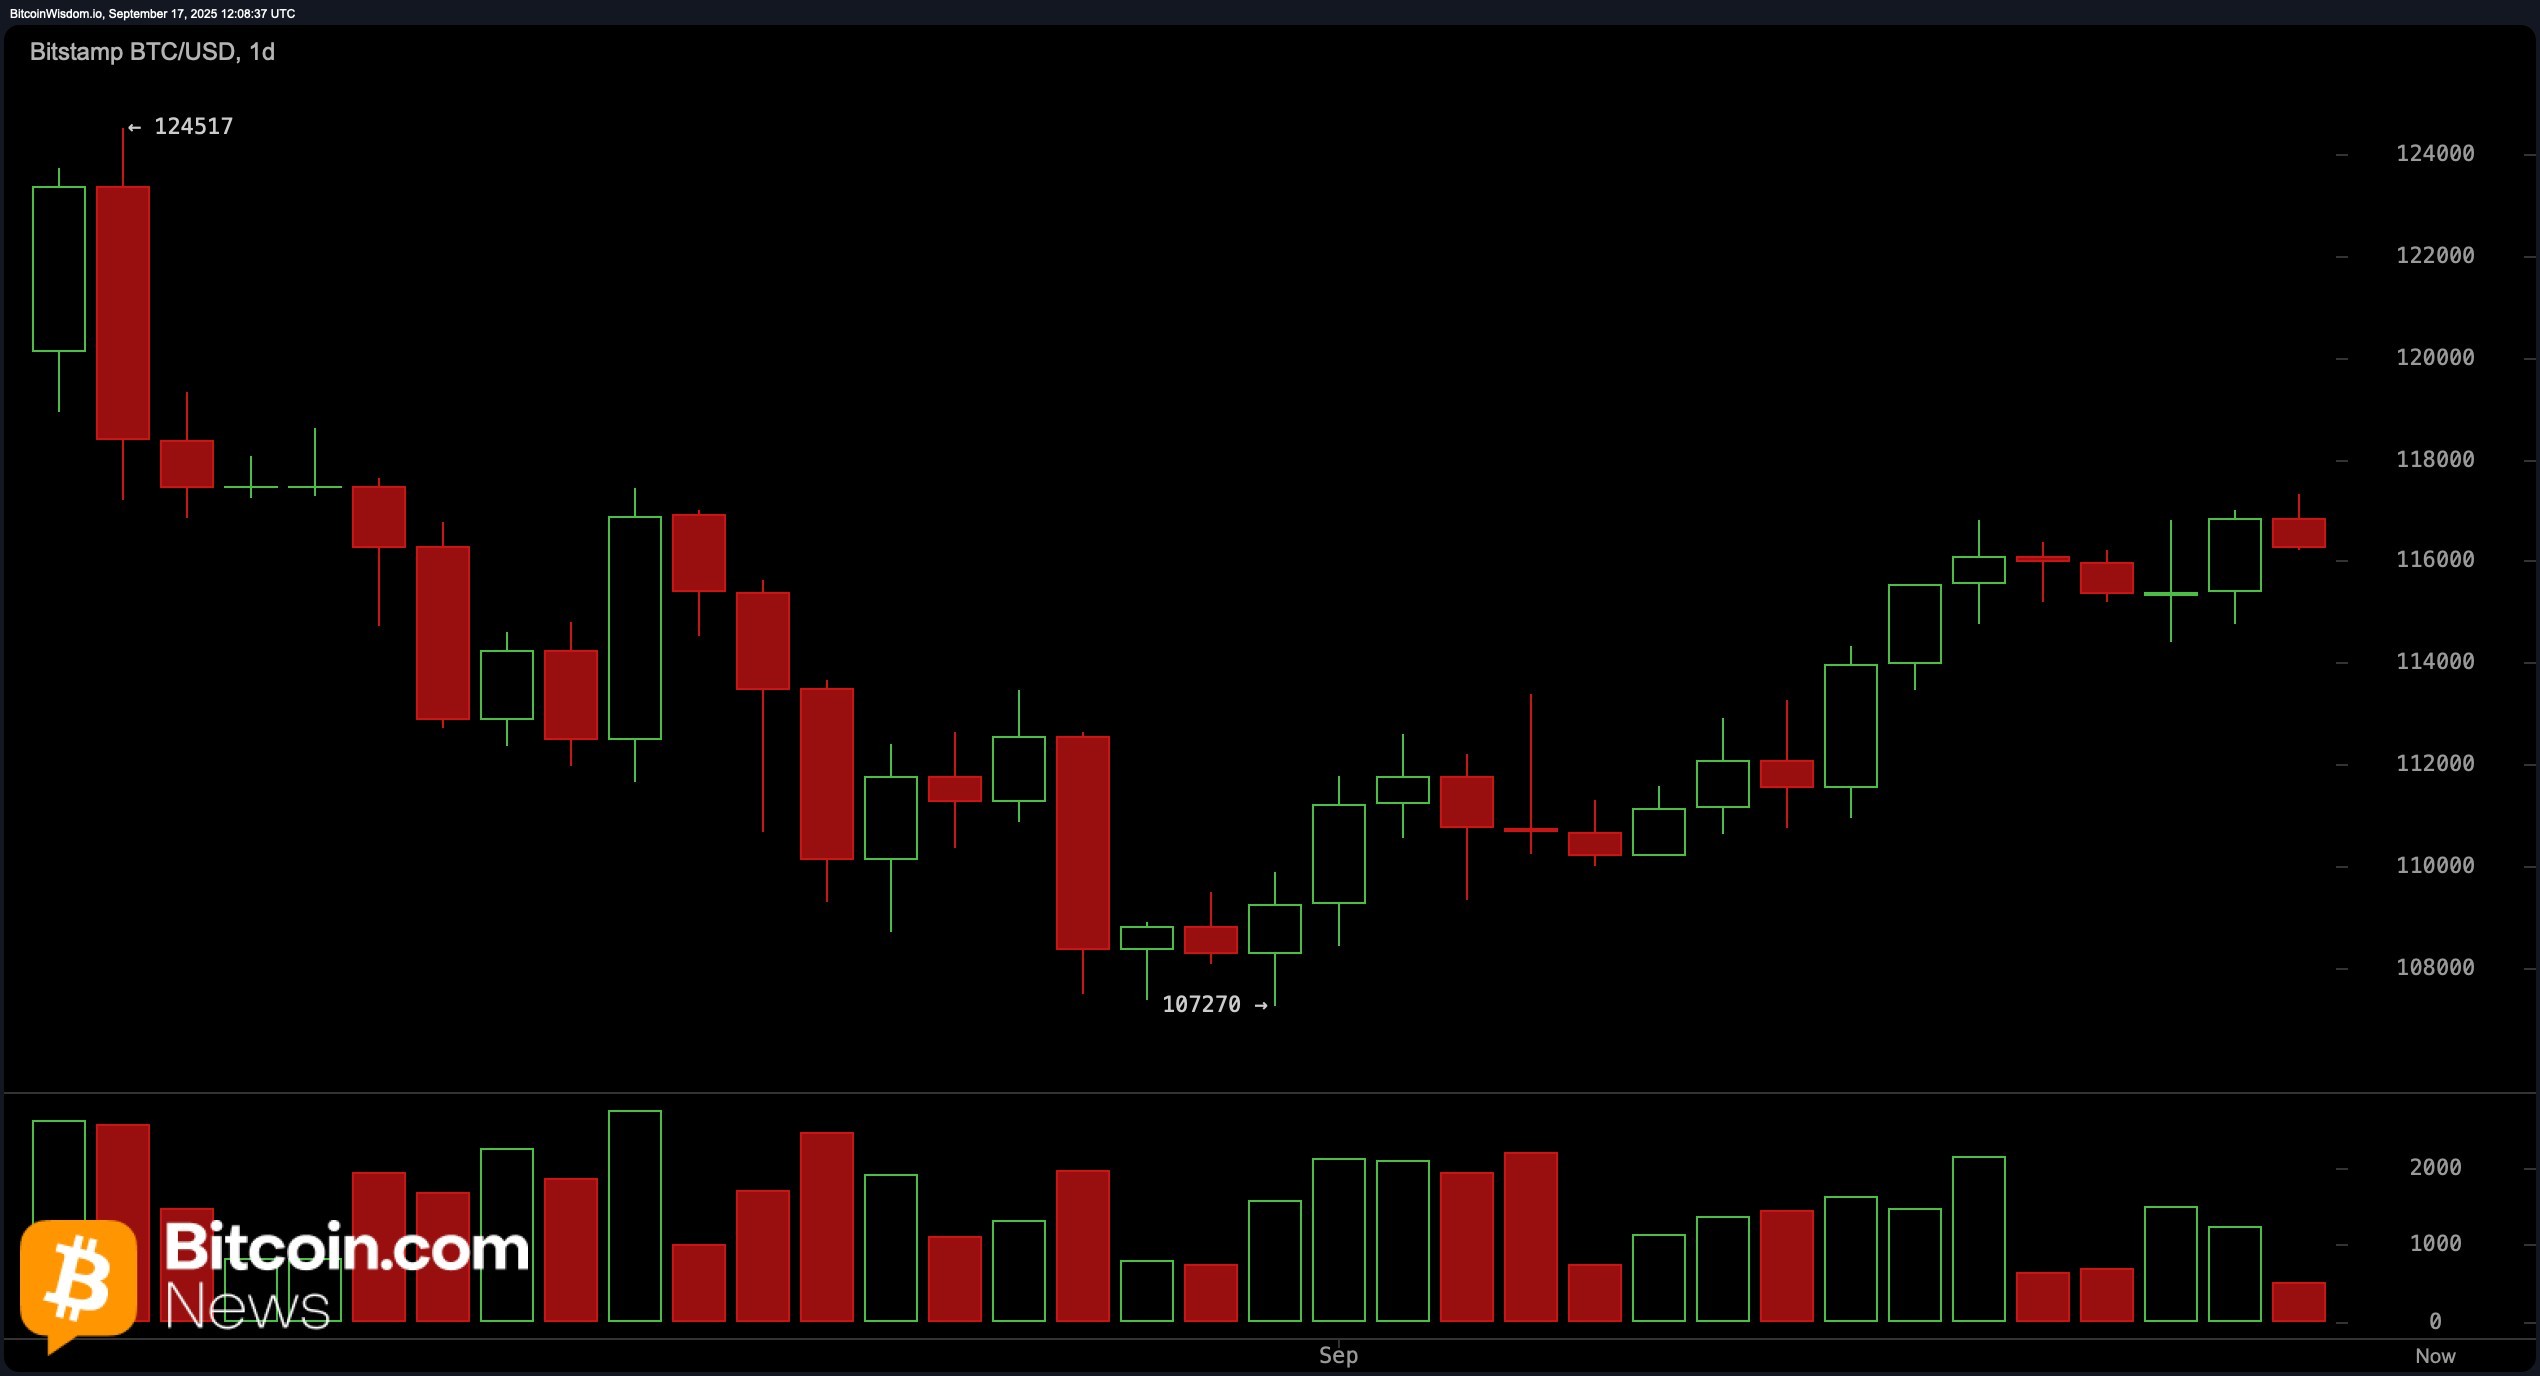
On the daily chart, bitcoin continues to consolidate just below the $117,500 resistance area after recovering from a local low of $107,270. While the recent climb appears technically constructive, declining volume throughout the rally suggests that bullish momentum is waning.
Key support remains near the $112,000 to $114,000 region, where a pullback could attract renewed buying interest. Traders may consider waiting for a dip into this range with a strong bullish reversal before initiating long positions. A breakout above $117,500 would need to be accompanied by high volume to confirm strength.
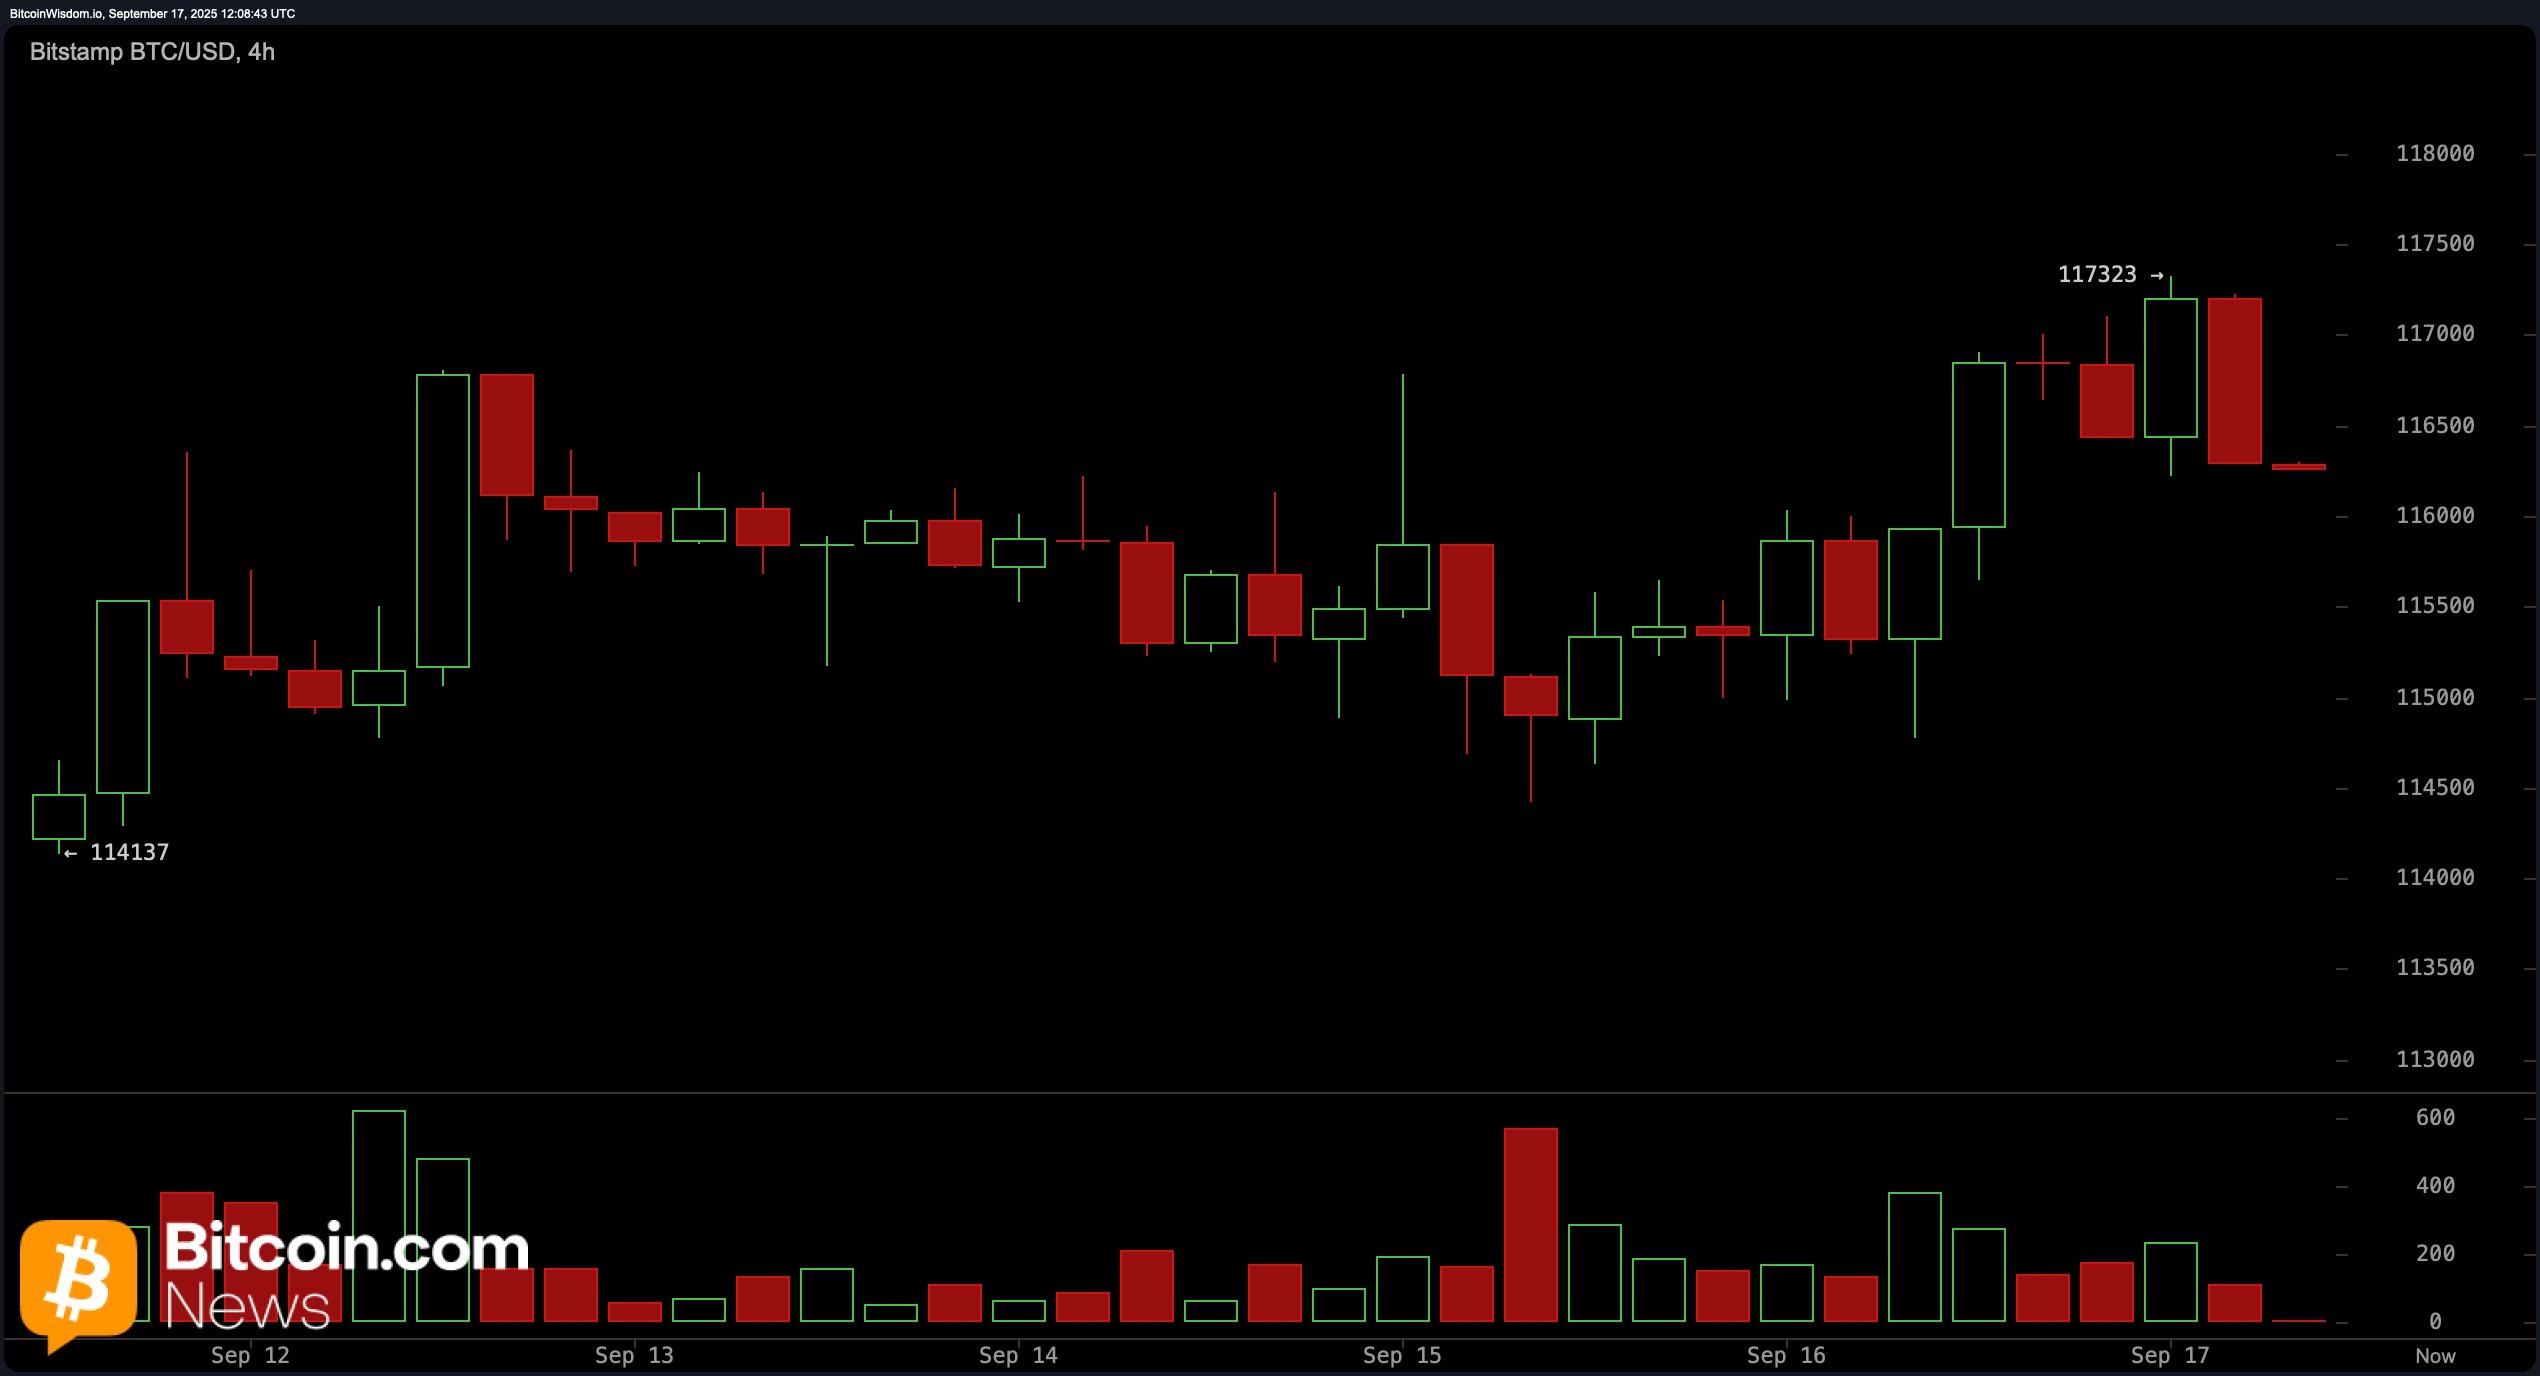
The 4-hour bitcoin chart reveals a more cautious outlook following a swift rally from $114,137 to $117,323. A bearish engulfing candle has appeared after the recent top, accompanied by a red volume spike, indicating strong overhead resistance and the possibility of a near-term correction. The $115,200 to $115,500 area could serve as a short-term bounce zone if buying pressure returns, but the absence of follow-through above $117,000 may limit upside potential in the immediate term. Unless price action clears recent highs with volume support, the bias remains cautious.
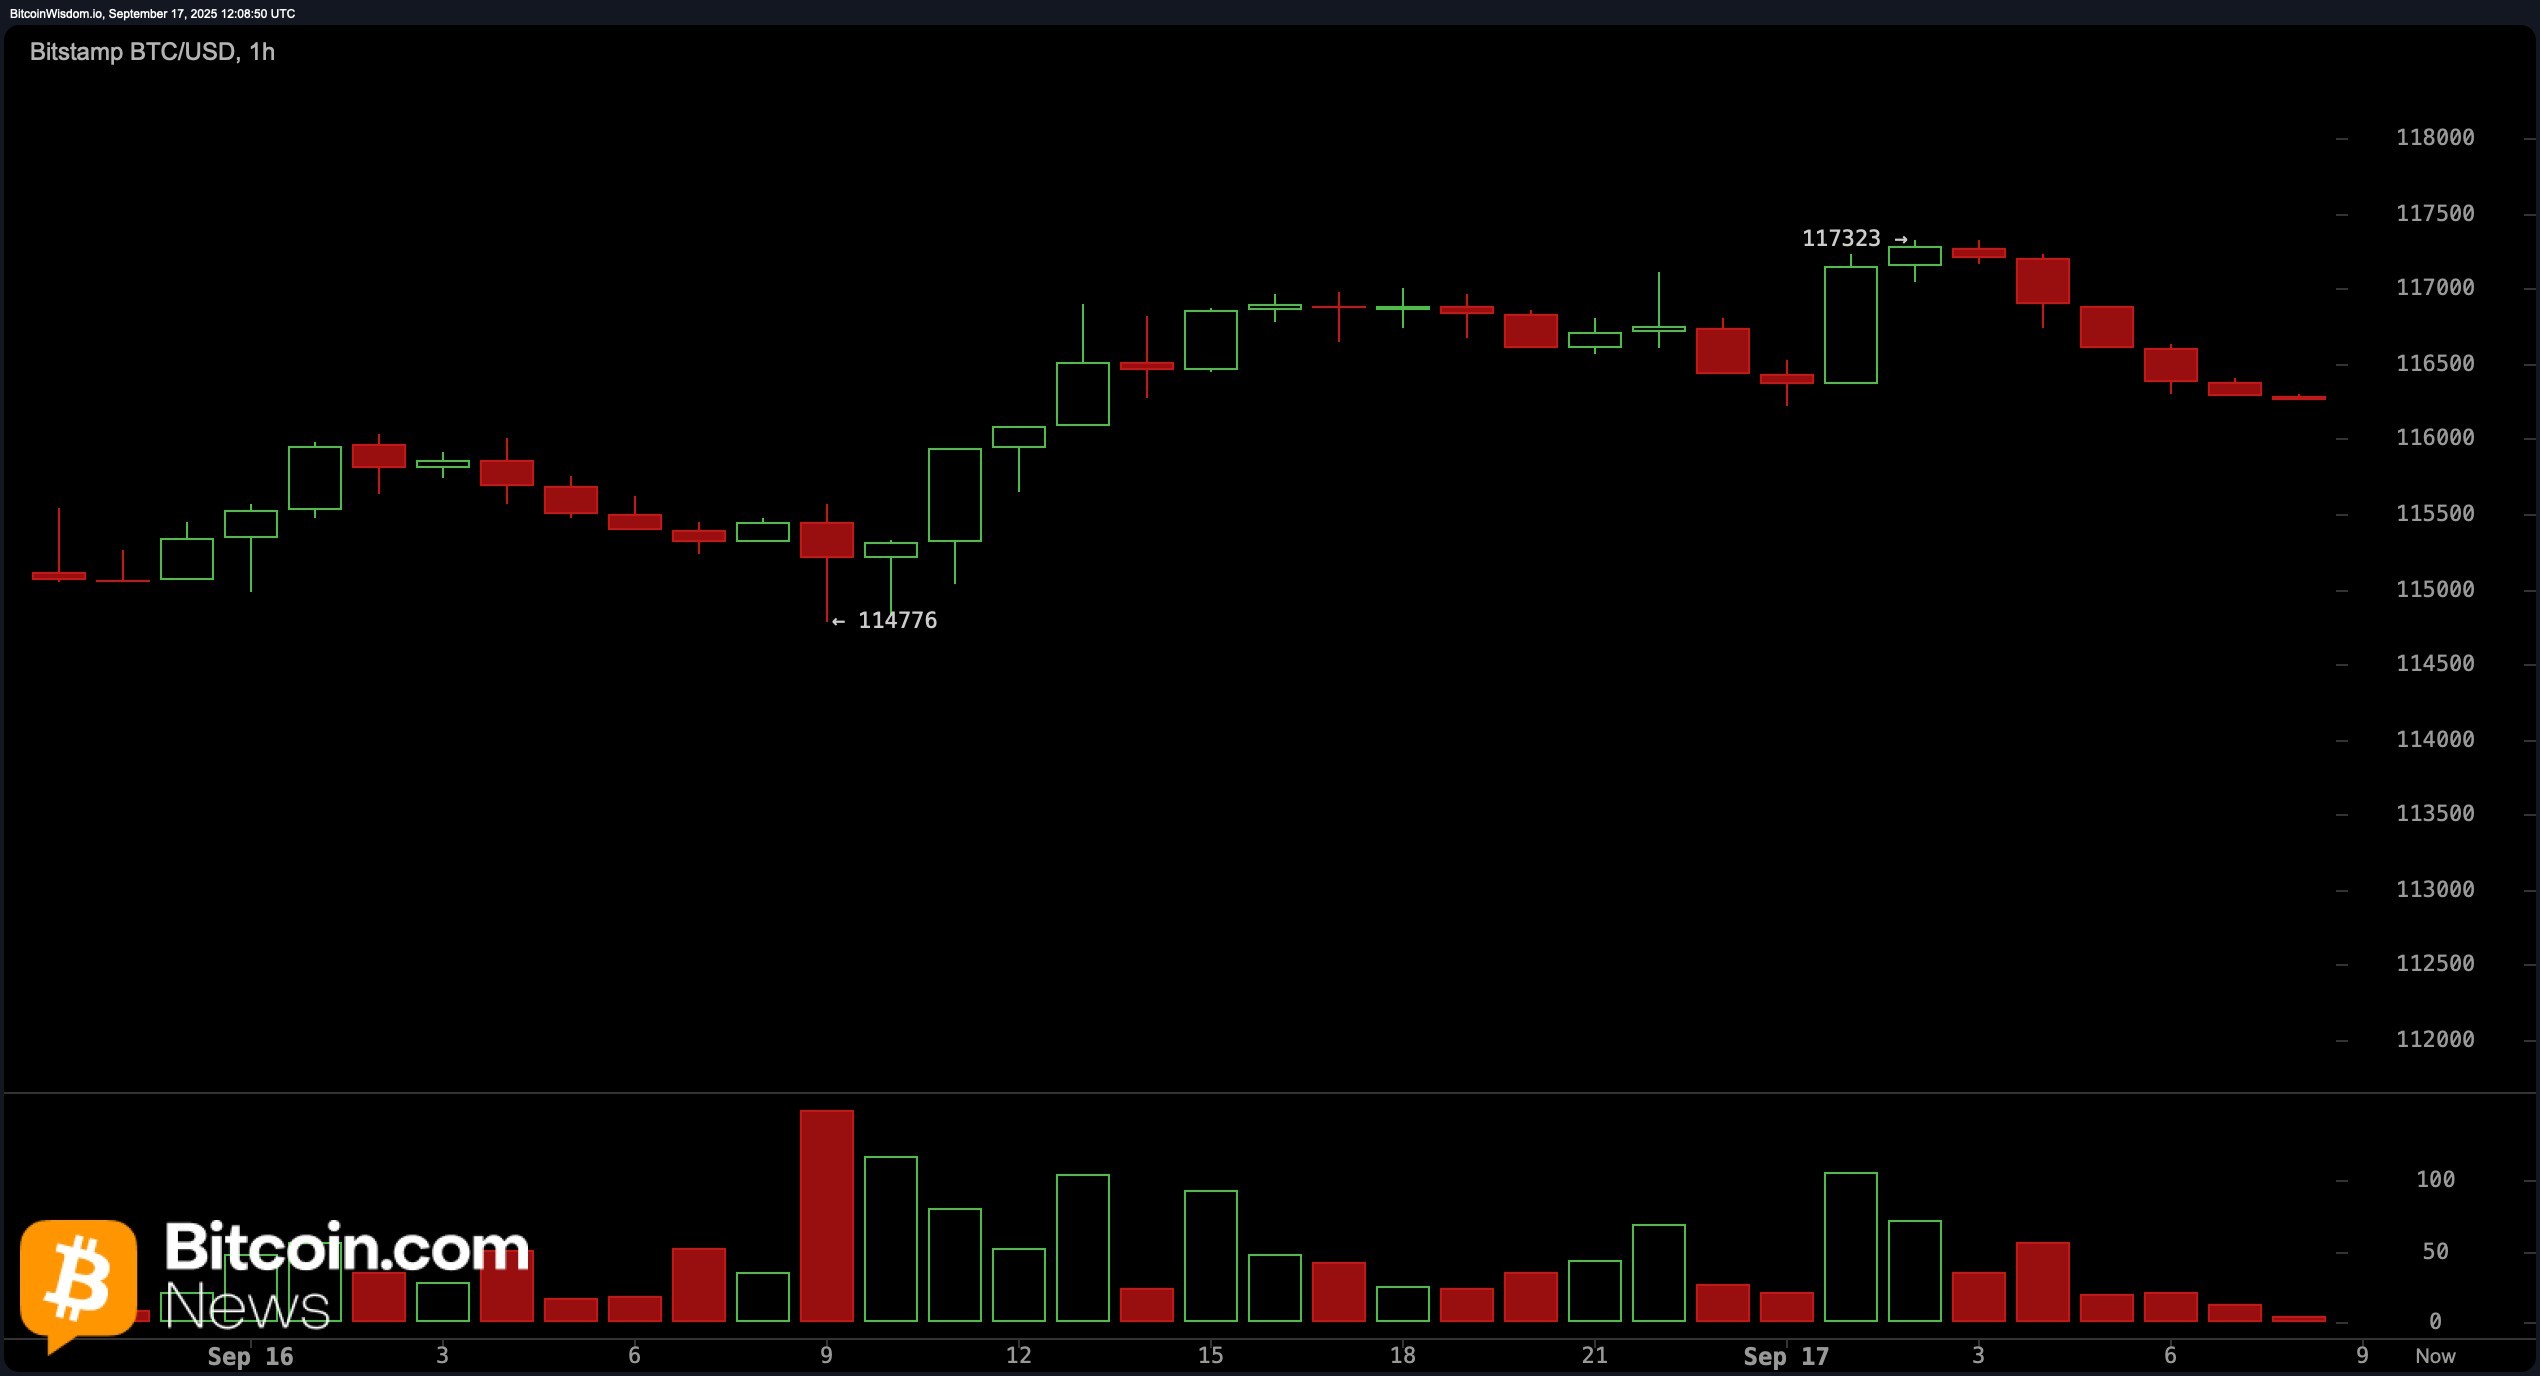
From a short-term perspective on the 1-hour chart, bitcoin‘s rising structure has broken down, and lower highs have emerged, highlighting weakening momentum. Although there is minor support near $115,800 to $116,000, recent red candles show a lack of buyer defense. Any potential scalp long trade around this level would require a definitive bullish reversal pattern, such as a hammer candle with increasing volume. Take-profit targets would be capped at around $116,800 to $117,000 unless a significant shift in volume occurs.
Oscillator readings point to market indecision. The relative strength index (RSI) is at 58, reflecting a neutral bias, while the Stochastic oscillator is elevated at 89, also neutral. Notably, the commodity channel index (CCI) at 115 and momentum at 5,114 both flash bearish signals, warning of an overextended move. The average directional index (ADX) reads 18, indicating a lack of trend strength. However, the moving average convergence divergence (MACD) level at 763 remains on a bullish signal, suggesting that deeper downside may still be limited without a structural breakdown.
Moving averages continue to support the broader uptrend. The 10-period exponential moving average (EMA) and simple moving average (SMA) stand at $114,950 and $114,906, respectively, with all major EMAs and SMAs—from 20 to 200 periods—currently aligned in a bullish posture. This confluence of moving averages below the current price reinforces a medium-term bullish bias, even as shorter-term price action turns cautious. However, if support levels near $115,500 fail to hold, a retest of $114,000 or lower becomes increasingly likely.
Bull Verdict:
Despite the waning momentum visible on lower timeframes, bitcoin remains technically supported by a robust stack of moving averages and a bullish MACD signal. If price holds above the $115,200–$115,500 zone and volume confirms a rebound, a breakout above $117,500 could reestablish upward momentum toward new highs.
Bear Verdict:
Short-term technicals indicate rising selling pressure and weakening momentum, particularly with a bearish engulfing candle on the 4-hour chart and multiple oscillators flashing sell or neutral signals. If the $115,500 support fails to hold, bitcoin may revisit the $114,000 level or lower, putting the recent rally at risk of a broader correction.
