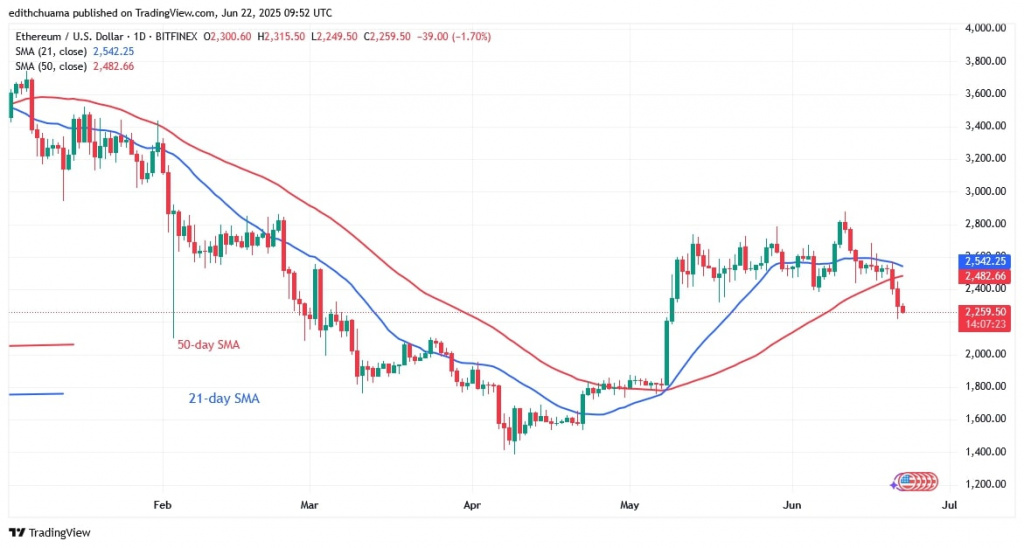
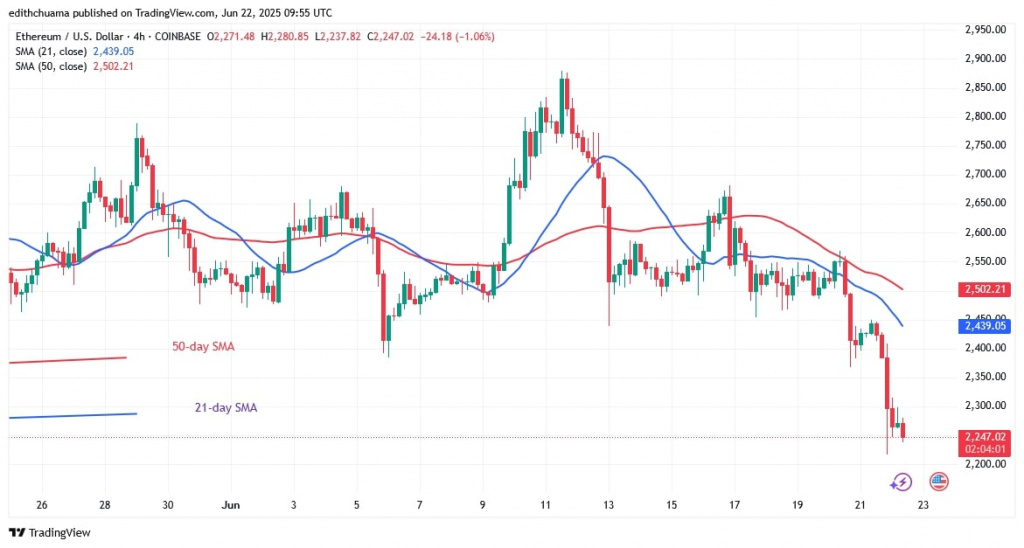
The price of Ethereum fell below the moving average lines and hit a low of $2,246.
Ethereum price long-term analysis: bearish
The largest altcoin fluctuated between $2,400 and $2,800 before its descent. Ether was trading in a range between $2,400 and $2,800 before its fall. Buyers tried unsuccessfully four times to keep the price above the $2,800 mark.
On June 11, as reported by Coinidol.com, the altcoin came under heavy selling pressure when it fell below the moving average lines. There will be selling pressure if the bears break the 50-day SMA and the $2,400 price level.
Ether is expected to fall further to the psychological price level of $2,000. Buyers will vigorously defend the psychological price level of $2,000, but ETH will fall further to $1,800 if the bears break the psychological price threshold. The price is above the $2,200 support but continues to fall.
ETH price indicators analysis
The price bars after the June 20 dip are below the moving average lines. The horizontal moving average lines on the 4-hour chart have slipped downwards, which is a sign of the continued decline.
Technical Indicators:
Key Resistance Levels – $4,000 and $4,500
Key Support Levels – $2.000 and $1,500

What is the next move for ETH price?
Ethereum is currently falling as it pulls back towards the psychological $2,000 mark. During the recent price action, Ethereum has been trading in a range between $2,400 and $2,800. The bears have broken below the $2,400 support and breached the range. Ether experienced a sharp decline as buyers pushed the price to $2,400.
Over the last 48 hours, Ether has traded above the $2,200 support level.

Disclaimer. This analysis and forecast are the personal opinions of the author. They are not a recommendation to buy or sell cryptocurrency and should not be viewed as an endorsement by CoinIdol.com. Readers should do their research before investing in funds.

