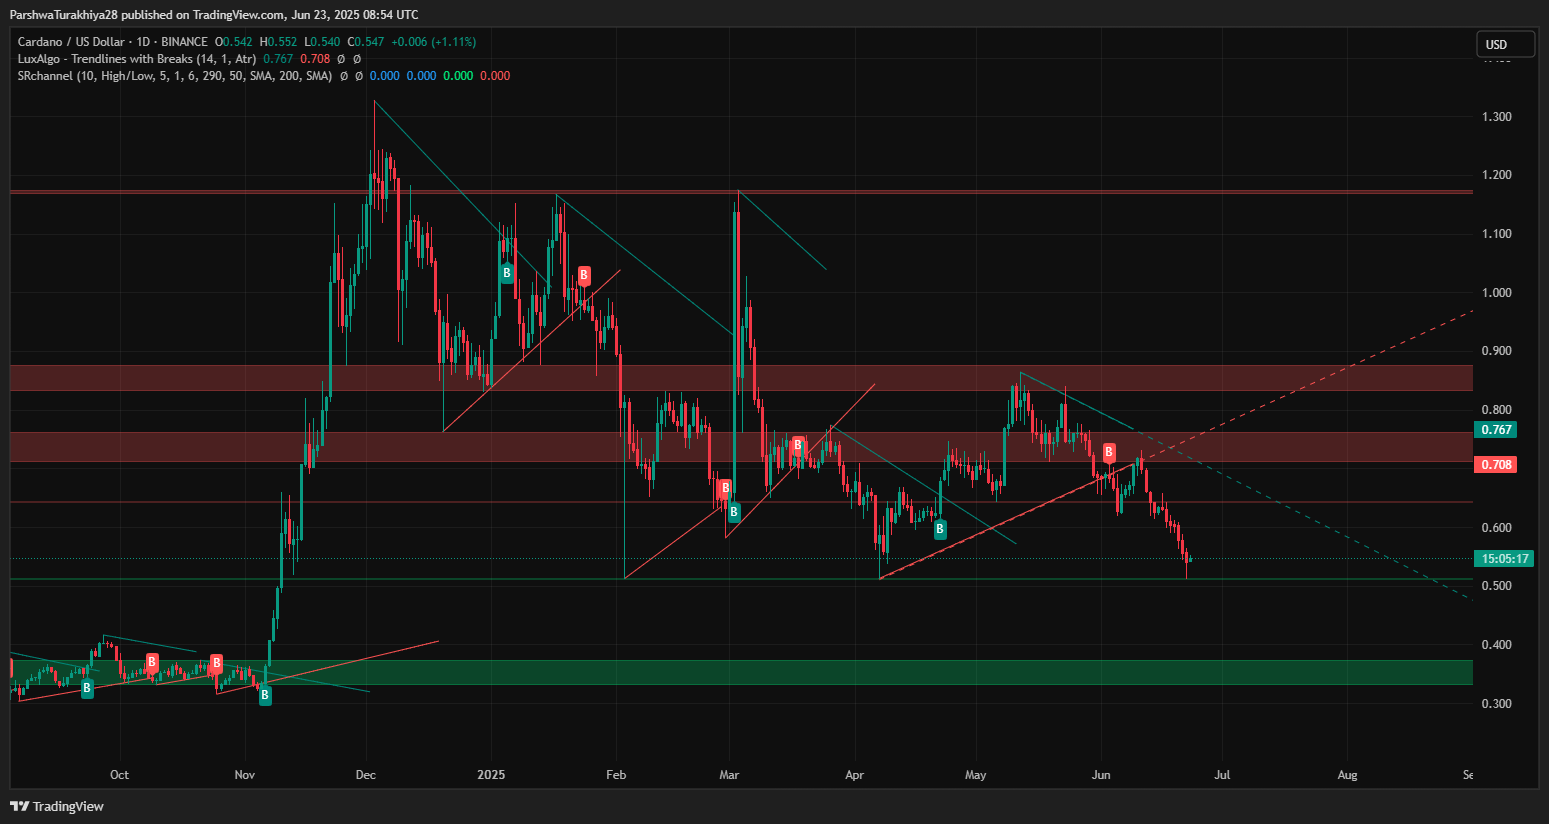
The Cardano price today is trading around $0.548, staging a minor rebound after dipping as low as $0.516 earlier in the session. Despite a modest recovery of nearly 3% from intraday lows, Cardano price remains under short-term bearish pressure following a sharp drop that broke several key support levels last week.
The broader outlook hinges on whether buyers can hold the pivotal $0.50–$0.52 range, which coincides with major Fibonacci retracement levels.
What’s Happening With Cardano’s Price?
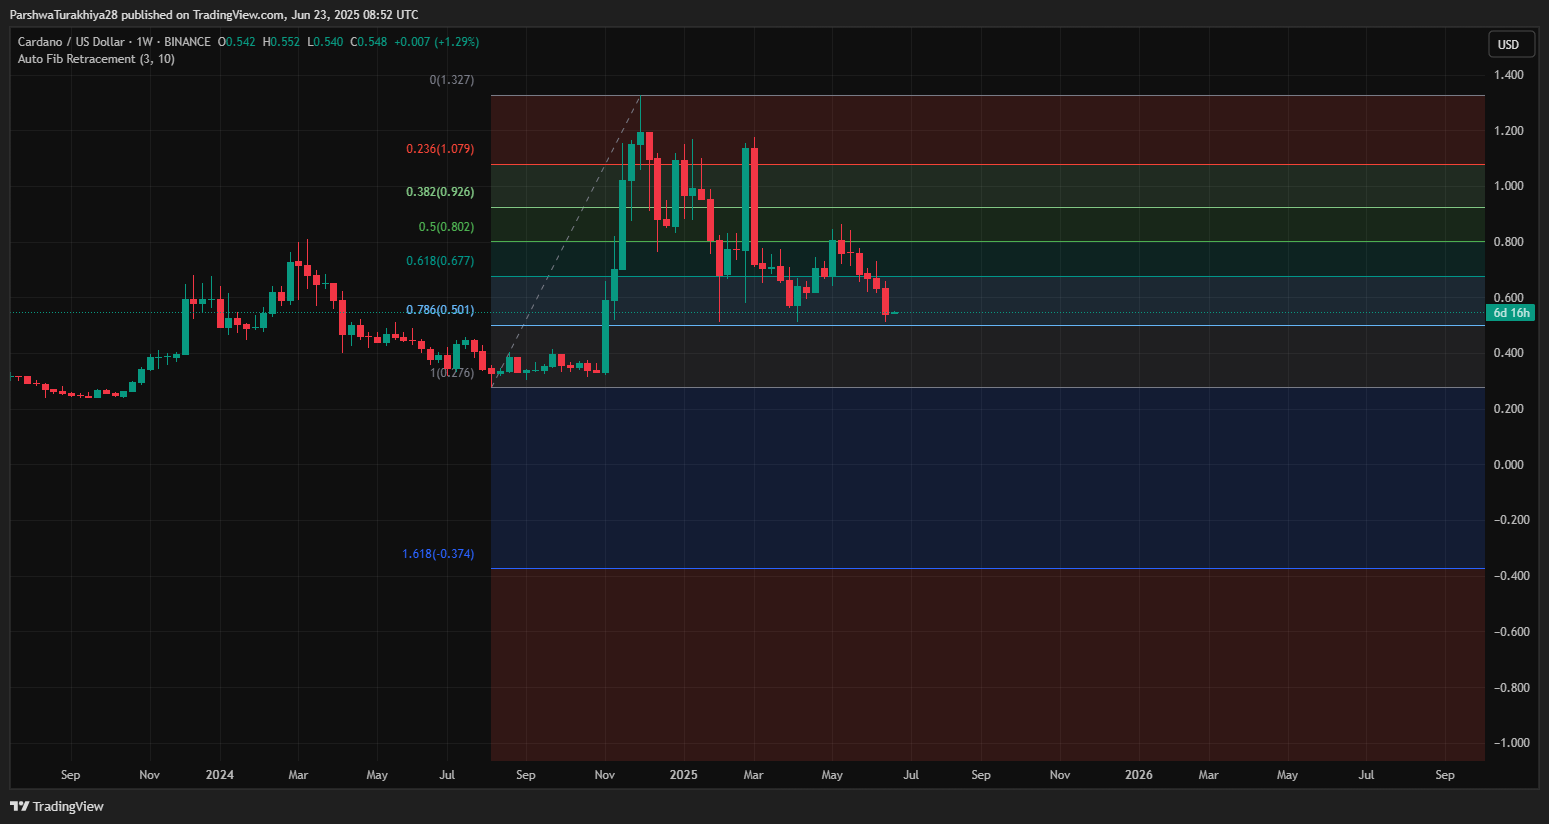
On the weekly chart, ADA has retraced more than 60% from its $1.327 peak, now sitting near the 0.786 Fibonacci level at $0.501. Historically, this zone marks a critical inflection point between extended downtrends and relief rallies. A breakdown below this threshold could open the path toward the $0.42–$0.45 region, while a bounce could target the $0.60–$0.68 recovery zone.
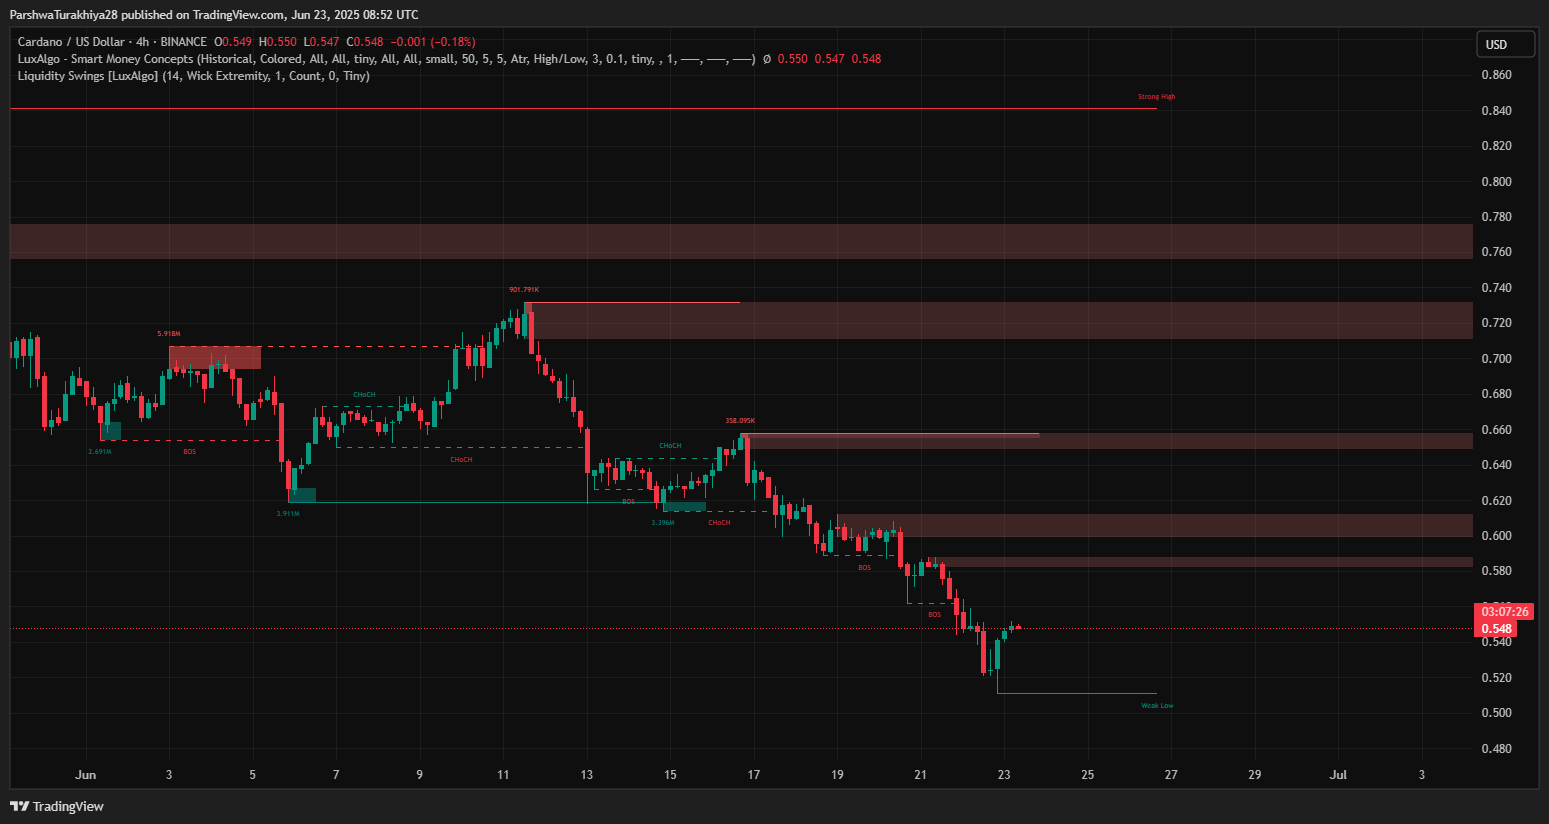
The 4-hour chart reveals Smart Money Concepts like BOS (Break of Structure) and CHoCH (Change of Character) forming beneath previous supply zones near $0.58, $0.63, and $0.66. Price action continues to react to these untested order blocks. Liquidity sweeps below weak lows were seen on June 23, followed by a small bullish CHoCH, indicating that whales may be attempting to trap late sellers.
Why Cardano Price Going Down Today?
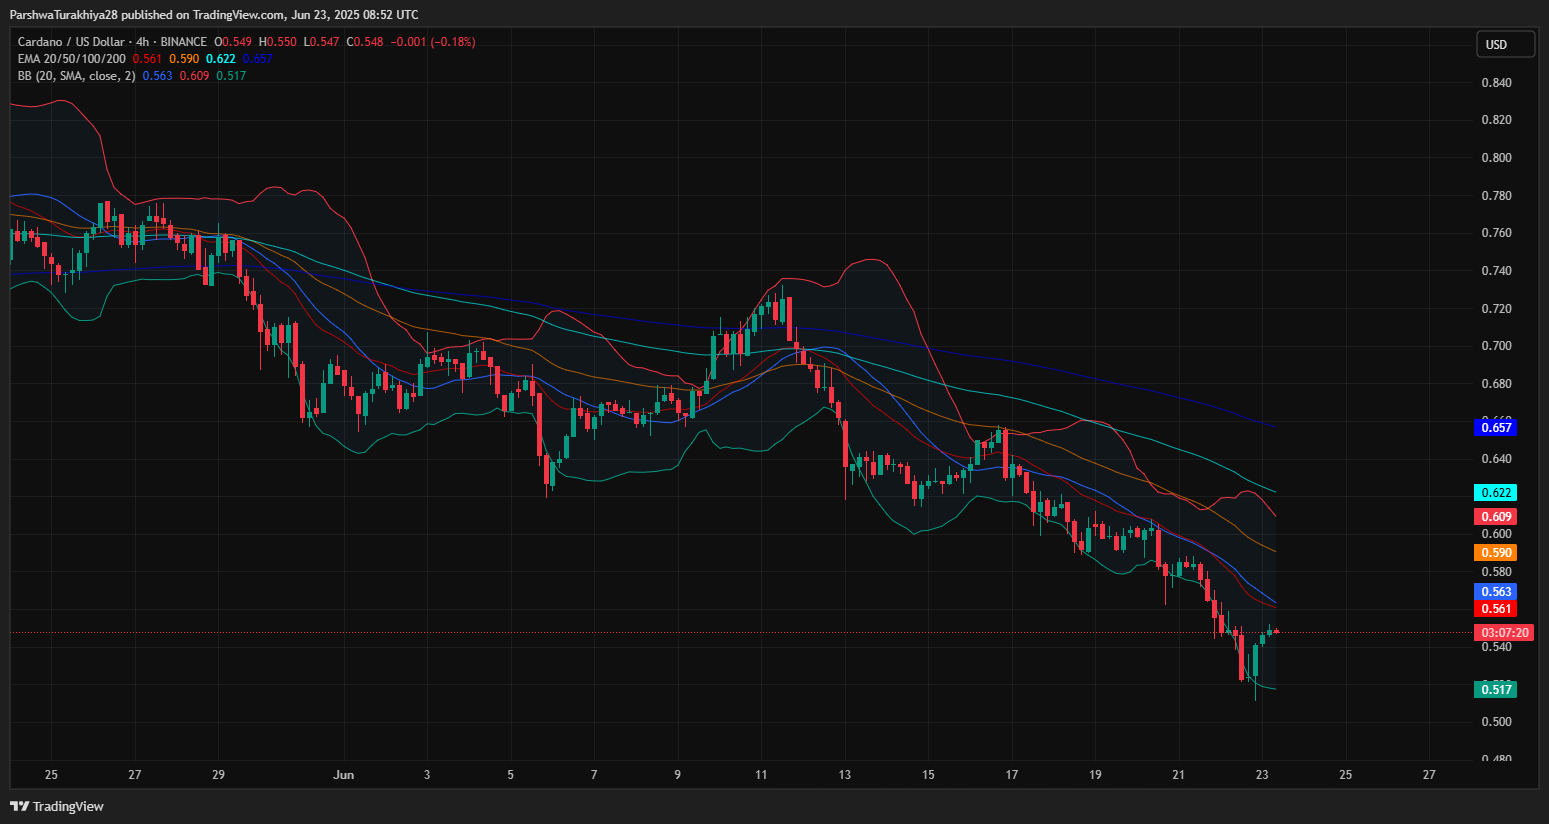
The current weakness stems from multiple confluent bearish signals. Bollinger Bands on the 4-hour timeframe are sharply constricting, with price getting repeatedly rejected at the mid-band and upper envelopes. Simultaneously, EMA 20/50/100/200 remain stacked bearishly above the current price, with $0.561 (EMA 20) acting as immediate resistance, followed by $0.590 (EMA 50).
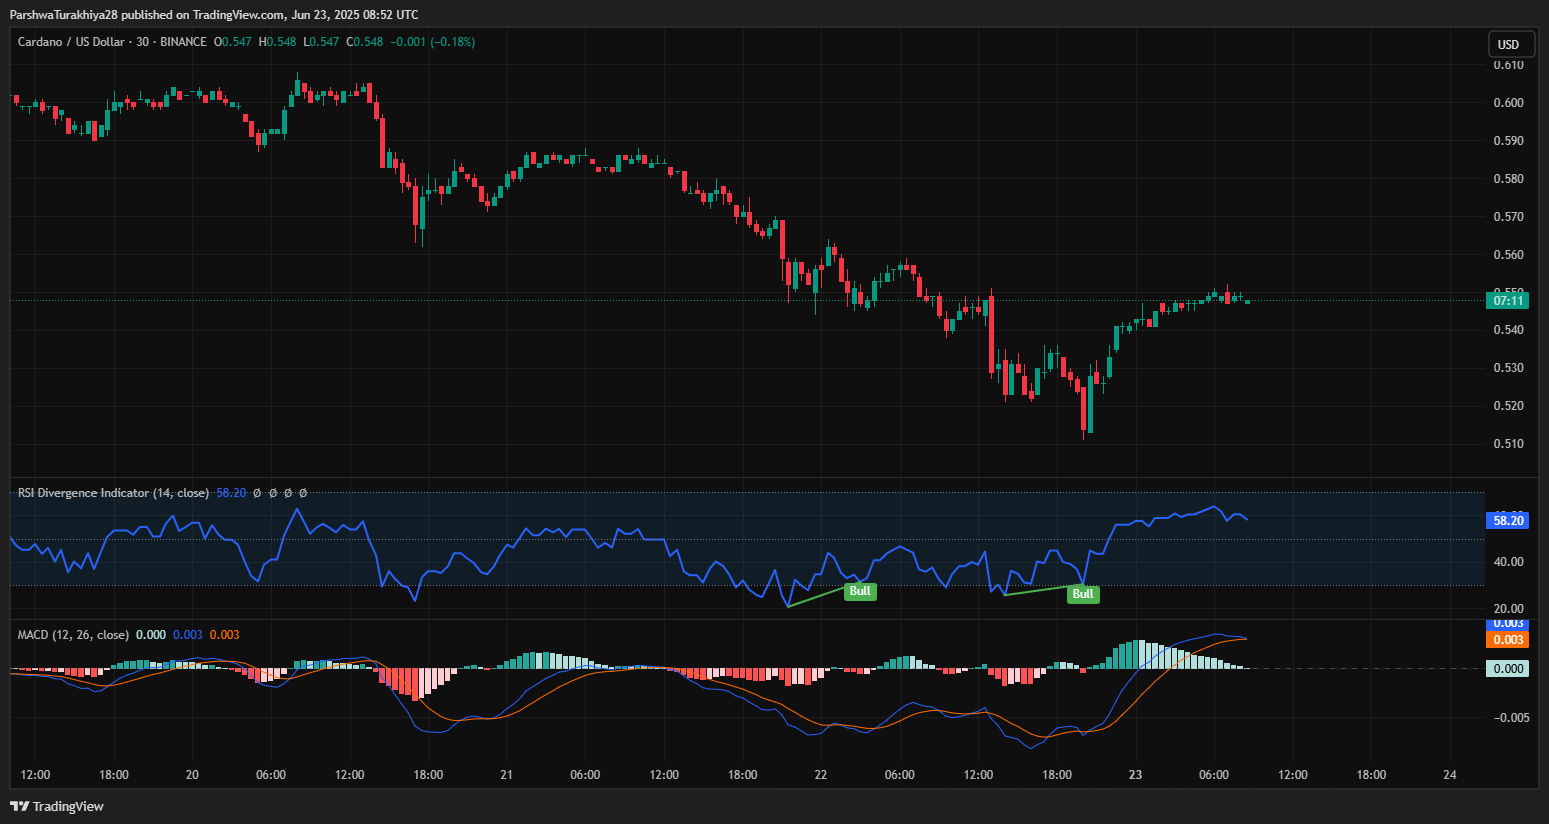
On the 30-minute chart, RSI sits at 58.20 after printing a bullish divergence — a short-term bounce signal that has already played out with the move from $0.516 to $0.552. However, MACD is beginning to flatten with minimal momentum, suggesting the current upside lacks strength unless new volume enters.
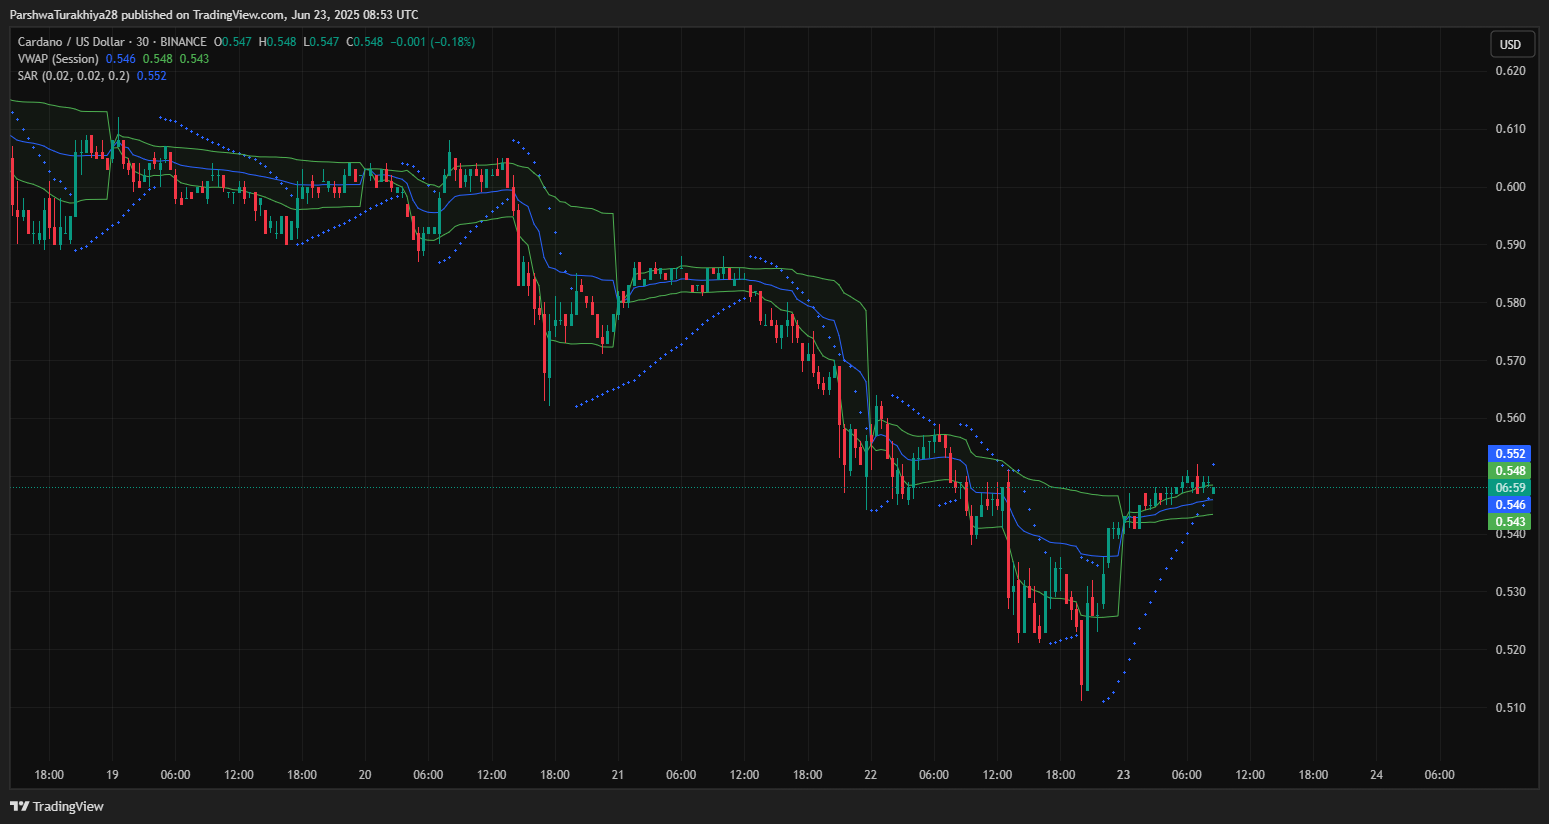
Moreover, Supertrend remains bearish on the 4-hour frame, and the Parabolic SAR dots continue to print above the price, both indicating that sellers are still in control. The VWAP has flipped into resistance at $0.546–$0.552, further capping any immediate upside.
Cardano Price Volatility Outlook: Can ADA Break Above $0.561?
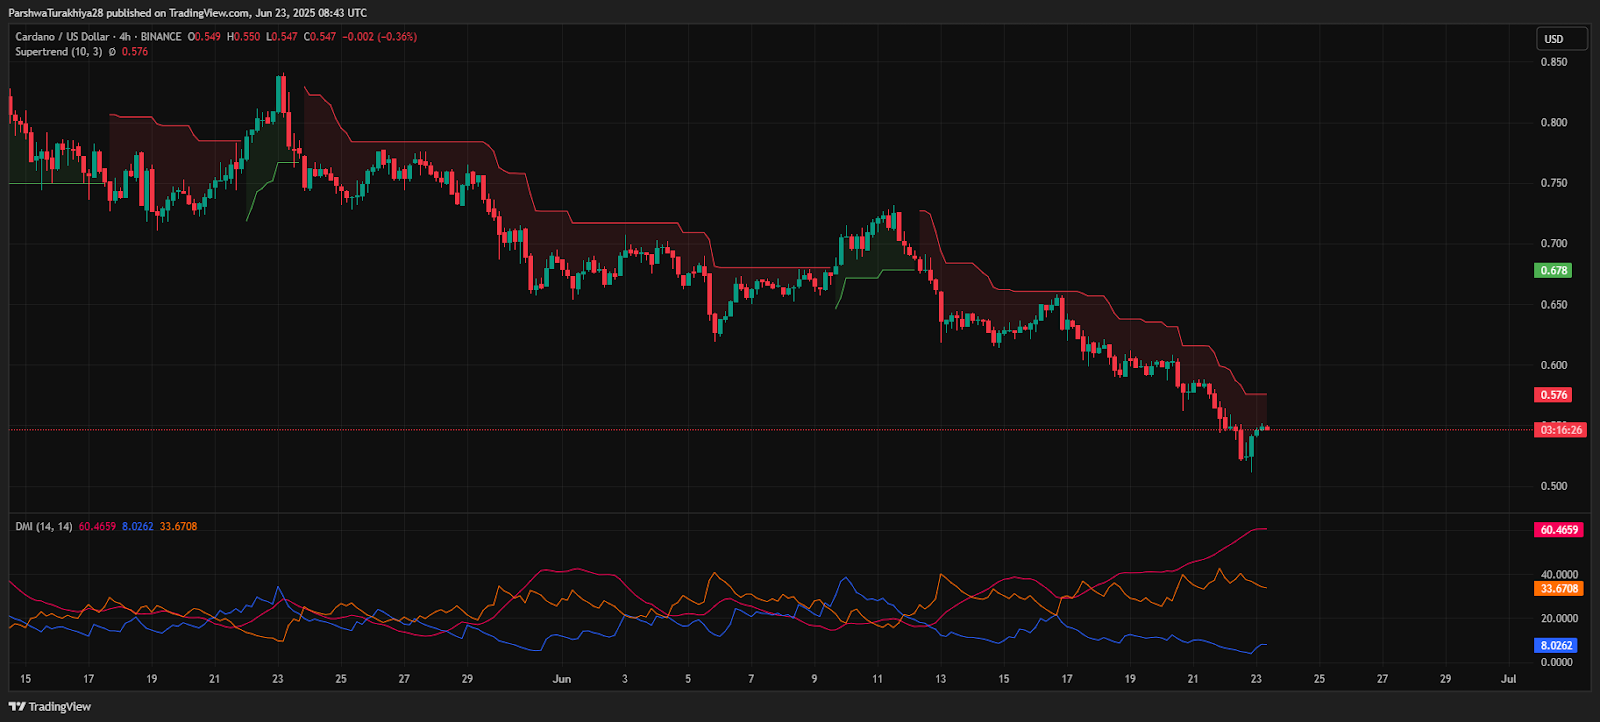
Despite short-term signals of a relief bounce, broader metrics like DMI and Chande Momentum Oscillator favor continued downside bias. The +DI remains suppressed while -DI and ADX rise together — a structure that typically accompanies trending declines. MFI remains muted, indicating limited inflow activity.
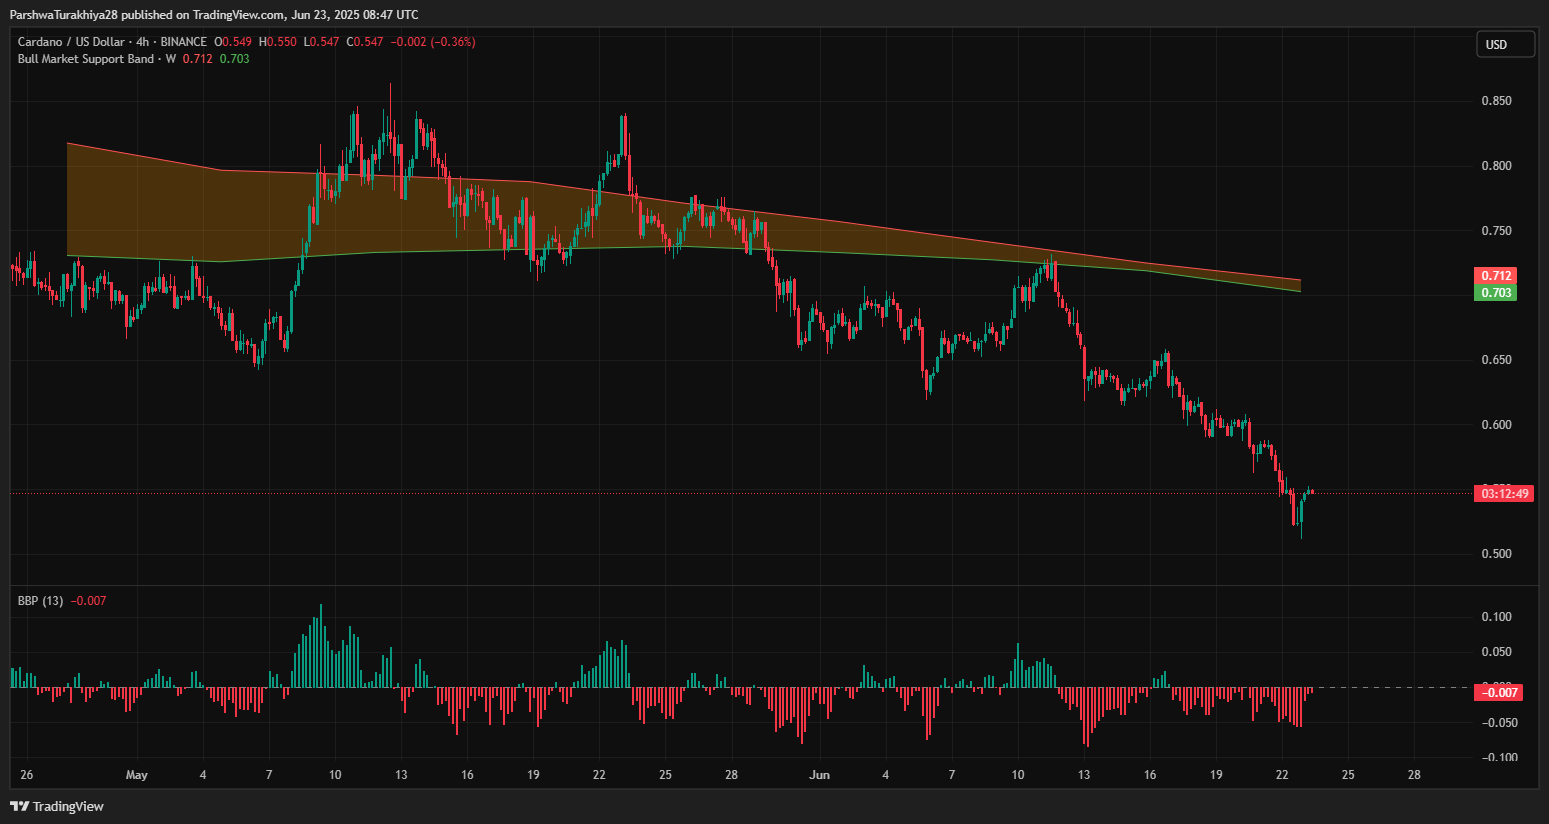
The Bull Market Support Band, located near $0.703–$0.712, remains far above the current trading zone and continues to slope downward — a warning sign for long-term bulls. However, the presence of a falling wedge pattern on the daily chart, paired with a liquidity sweep below weak lows, hints at a potential volatility-driven reversal attempt if $0.50 holds.
Cardano Price Forecast for June 24 2025
If bulls can confirm a hold above $0.516 and reclaim $0.561 with volume, the next upside targets lie at $0.590 and $0.622. A decisive break above $0.622 could flip short-term momentum and allow ADA to revisit the $0.66–$0.68 supply band.
On the flip side, failure to maintain the $0.50 handle could expose ADA to deeper losses toward $0.475 and possibly the $0.42–$0.45 demand cluster. Traders should monitor reaction to the EMA cluster and RSI rollover for directional confirmation.
Cardano Price Technical Forecast Table: June 24
| Indicator/Zone | Level (USD) | Signal Description |
| Resistance 1 | 0.561 | EMA 20 and Bollinger mid-band |
| Resistance 2 | 0.622 | EMA 100 + previous BOS rejection |
| Support 1 | 0.516 | Recent low + minor demand reaction |
| Support 2 | 0.501 | 0.786 Fibonacci support |
| RSI (30-min) | 58.20 | Near overbought, cooling off |
| MACD Histogram | Neutral | Weakening bullish impulse |
| Supertrend (4H) | 0.576 | Bearish unless reclaimed |
| SAR (30-min) | 0.552 | Bearish dots above price |
| VWAP Zone | 0.546–0.552 | Acting as resistance |
| Bull Market Band (1W) | 0.703–0.712 | Trend ceiling, bearish slope |
| DMI ADX | -DI > +DI | Downtrend strength rising |
Disclaimer: The information presented in this article is for informational and educational purposes only. The article does not constitute financial advice or advice of any kind. Coin Edition is not responsible for any losses incurred as a result of the utilization of content, products, or services mentioned. Readers are advised to exercise caution before taking any action related to the company.
