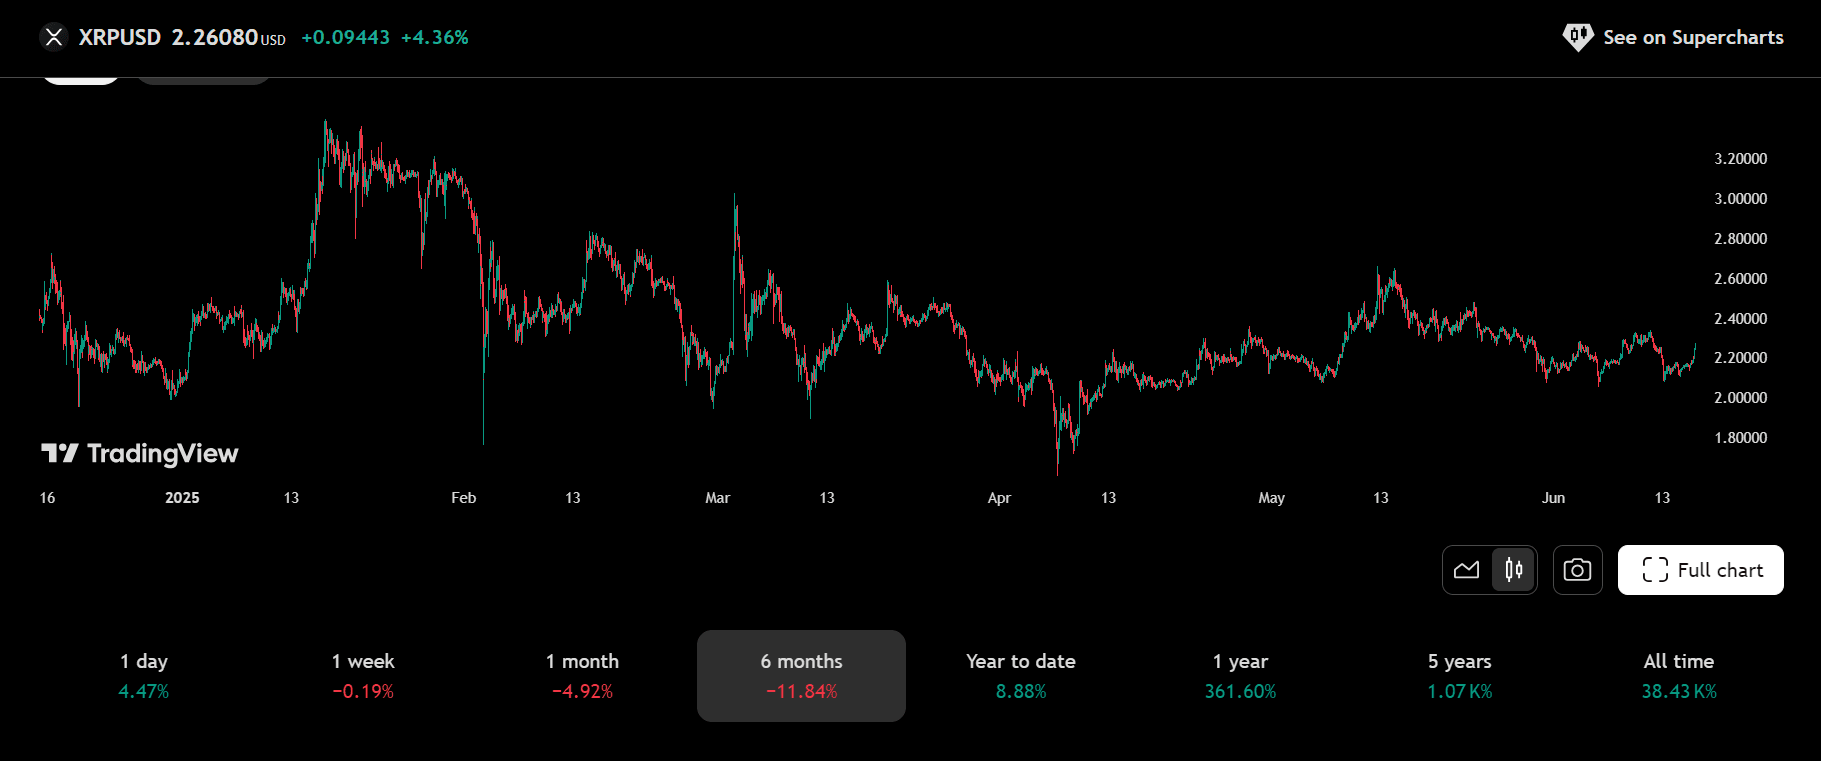
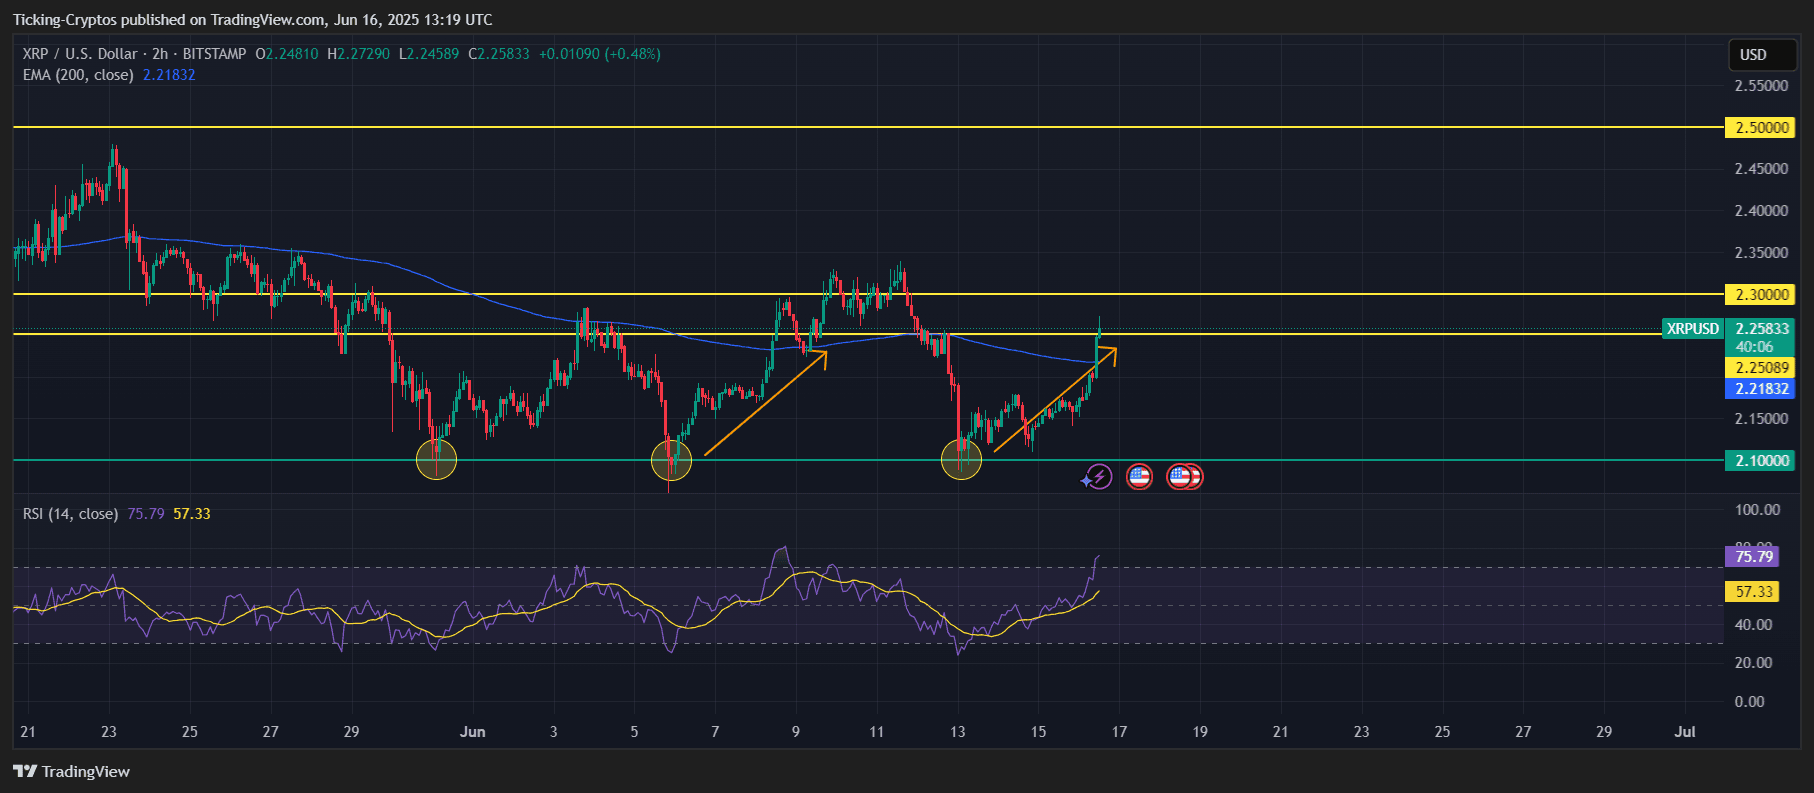
XRP is currently trading at $2.26, marking a 4.36% increase on the day. Over the past six months, however, it’s still down by 11.84%, reflecting a broader cooling-off period after its explosive 2024 performance. Yet, the 361% gain over the past year highlights the token’s strong macro trend—and it may be gearing up for another breakout. XRP/USD chart - TradingView Across shorter timeframes: This data suggests XRP is trying to flip momentum from neutral to bullish—especially after holding the $2.10 support zone for the third time this month. In our previous analysis, we highlighted a classic ascending triangle pattern forming above the key support at $2.10. That setup just confirmed a breakout. XRP/USD 2-hours chart - TradingView As seen in the chart above: The breakout above $2.25 opens up space toward $2.30 next, which is the immediate resistance. If bulls maintain control and broader market sentiment improves, $2.50 becomes a valid short-term target within the next 5–7 days. Given the current breakout structure, reclaimed EMA, and strengthening market tailwinds (including BTC recovery), XRP is well-positioned to target: As long as XRP holds above the 200 EMA and maintains higher lows, the bullish thesis remains intact. $XRP, $RippleXRP Price Outlook: Performance and Momentum Shifts
XRP Technical Analysis: Setup Playing Out Perfectly
XRP Price Prediction: $2.50 in Sight?
XRP Price Prediction: Can Ripple Surge to $2.50 This Week?