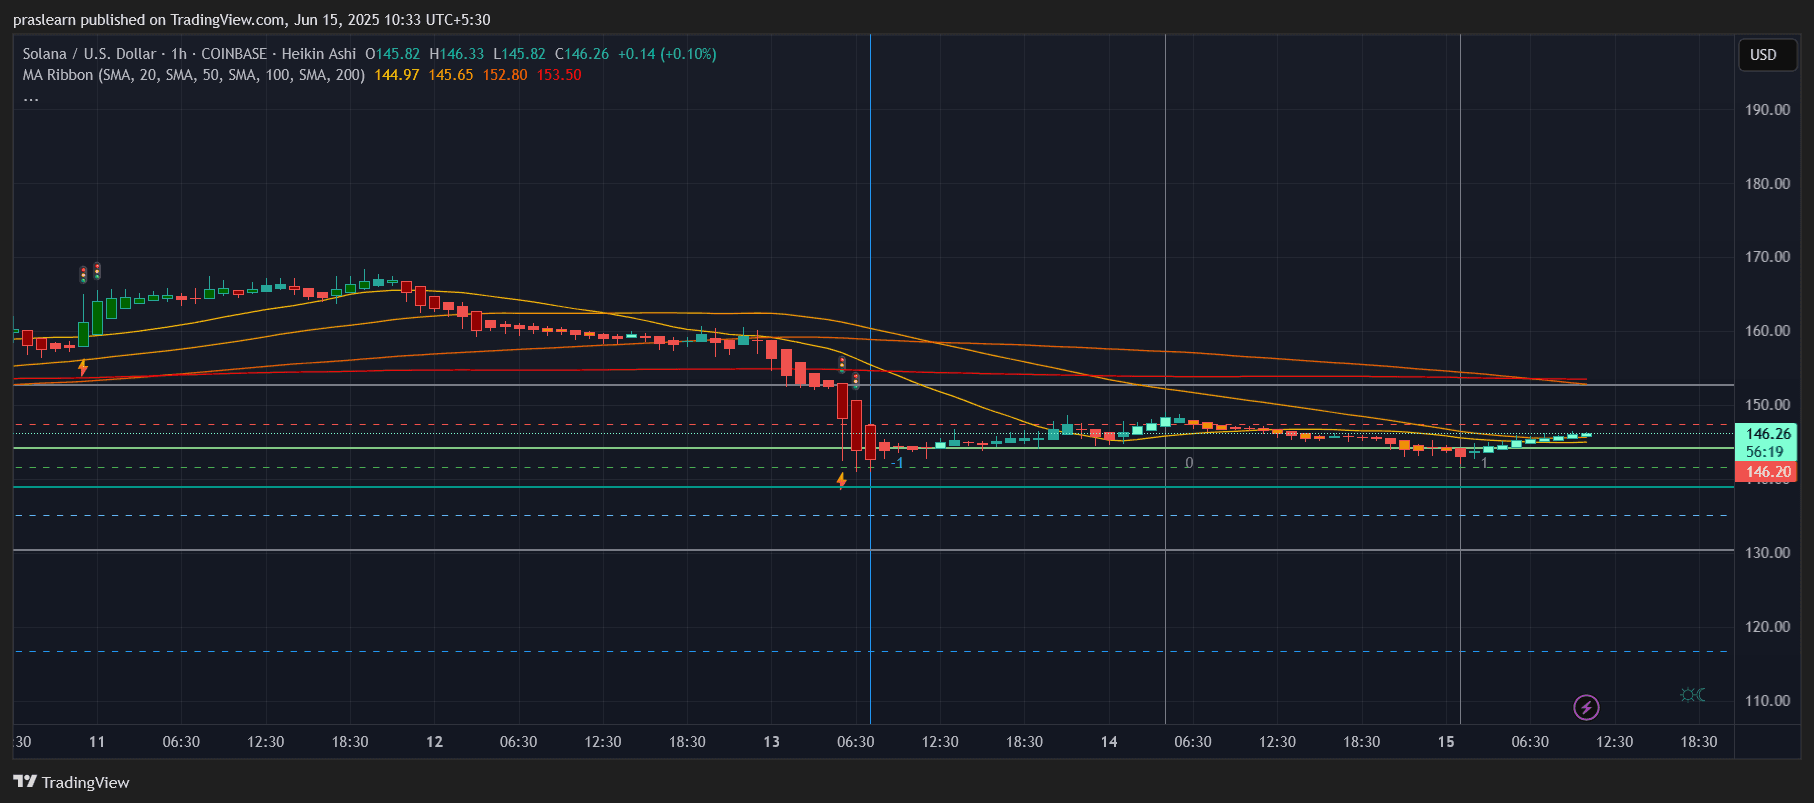
Solana (SOL) price is once again under the microscope as its price clings to a critical support level near $145. After a steady decline from its recent highs around $168, the popular Layer-1 blockchain token now faces mounting bearish pressure across both daily and hourly timeframes. Technical indicators are flashing warning signs, and if current support breaks, Solana price could see a swift move downward. However, the battle between bulls and bears isn’t over yet. This article dives deep into Solana’s price action, examines chart patterns, moving averages, and Fibonacci projections, and offers a>Solana Price Prediction: What’s Going On With Solana Price Right Now? Solana (SOL) price is trading around $146, showing signs of weakness across both the daily and hourly timeframes. The Heikin Ashi candles on the daily chart reveal consistent bearish pressure, with price struggling to hold above key moving averages. The SOL price recently tested the 20-day SMA near $145.11, now acting as resistance, while the 50-day SMA at $160.61 remains a strong barrier for any bullish recovery. The 200-day SMA at $174 is out of reach for now, emphasizing the broader bearish trend. SOL price has now formed a lower high and a lower low pattern—classical signs of a weakening uptrend and potential shift into a more sustained downtrend. If $145 fails to hold on the daily chart, Fibonacci projections suggest a potential fall toward the $131–$125 zone, which is marked as the next key support cluster. Zooming into the hourly chart, Solana price shows a short-term attempt at consolidation. Price recently bounced from the $142.80–$143.20 demand zone after a steep sell-off. However, momentum remains capped by the 100-hour and 200-hour SMAs at $152.80 and $153.50 respectively, both trending downward. There’s a clear descending triangle pattern forming, with horizontal support at $145 and lower highs pressing from above. This typically signals breakdown potential. If SOL price breaks below this support on high volume, a swift drop toward $135 could occur. The current Solana price is sandwiched between resistance at $149–$152 and support at $143–$145. If the price drops below $145, we can calculate Fibonacci-based targets. Taking the recent high of $168 and the recent low of $142, a 1.618 extension gives us: Target = 142 - (168 - 142) * 1.618 ≈ 142 - 41.6 ≈ $100.4 Although $100 is an extreme target, intermediate support lies at $131.70, which aligns with previous consolidation zones in April. Yes—but it needs a clear breakout above $152, preferably with a bullish crossover of the 50- and 100-day moving averages. A sustained close above $160 would invalidate the bearish outlook and may push SOL price back toward $180. Until then, the bears remain in control, and the hourly chart shows a bear flag structure rather than a bullish recovery. The flattening of the moving averages signals a potential accumulation zone, but not enough strength to rally—yet. If current support at $145 breaks: If bulls reclaim $152–$160 convincingly: Solana price is at a make-or-break level. A drop below $145 could trigger cascading stops and bring the price quickly to $135 or lower. On the flip side, a breakout above $152 could reignite bullish momentum. Traders should watch for volume confirmation and moving average crossovers before positioning. Until then, the path of least resistance is to the downside. $SOL, $Solana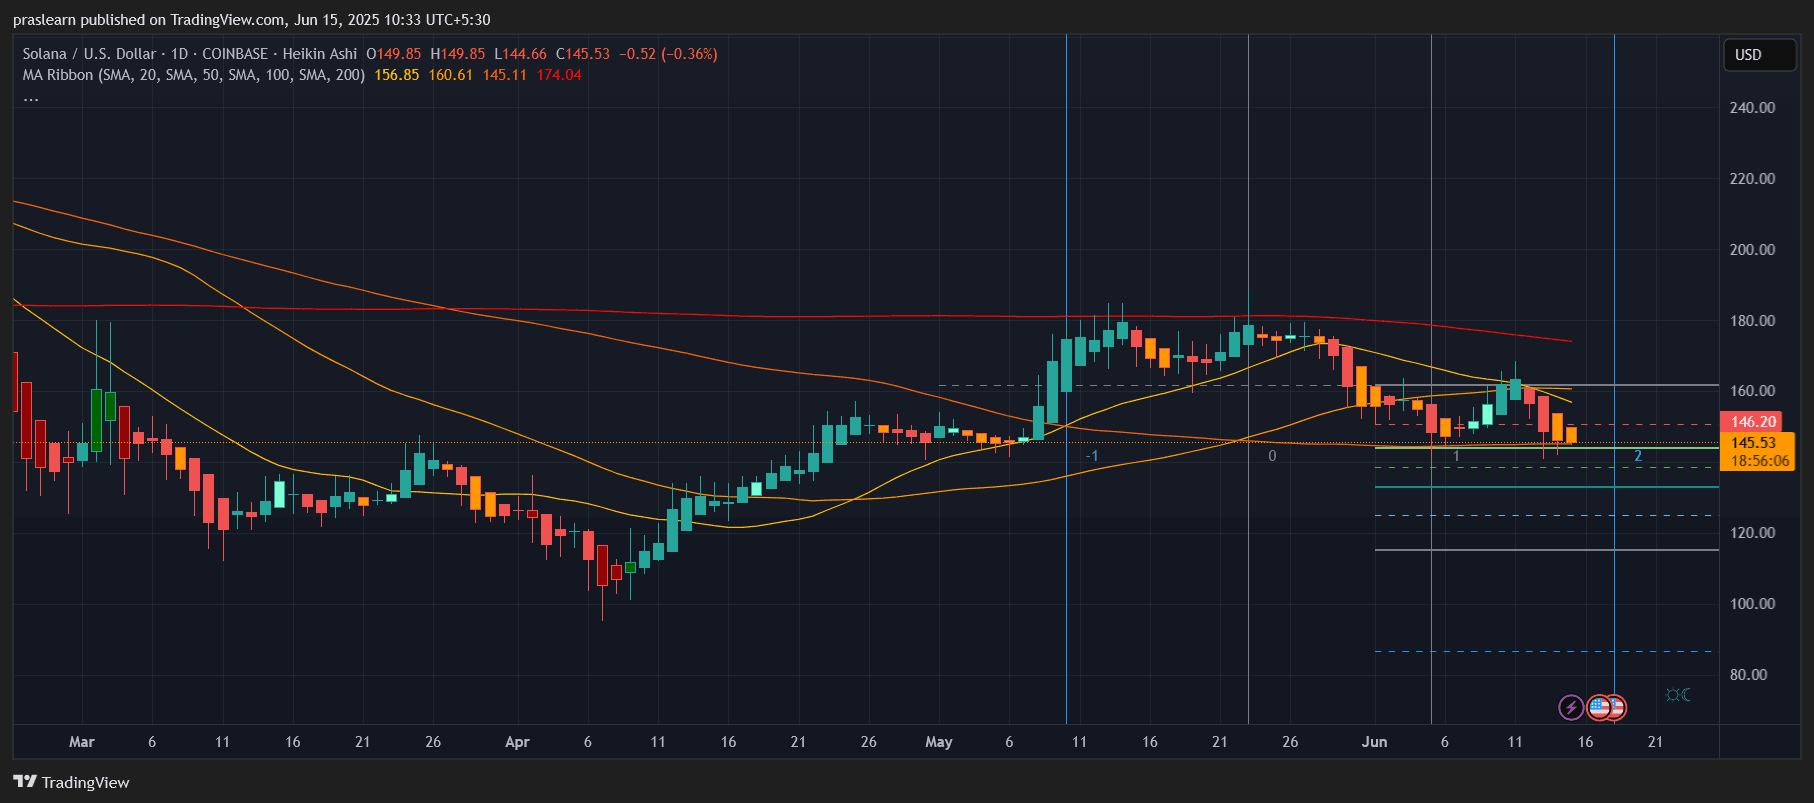
What Does the Hourly Chart Tell Us?
Key Technical Levels to Watch
Can SOL Price Still Recover?
Solana Price Prediction: What Happens Next?
Solana in Trouble? Here’s What the Charts Say
SOL/USD Daily Chart- TradingView
SOL/USD 1 Hr Chart- TradingView
