As of June 4, 2025, Dogecoin (DOGE) is trading at $0.19210 against the US Dollar, showing a modest decline of 0.43% in the current session. The popular meme cryptocurrency has been navigating a critical price zone between $0.18650 and $0.21600, with the market displaying signs of consolidation after a significant downtrend from higher levels. DOGE/USD 2-hours chart - TradingView The 2-hour chart reveals several important technical developments: The Relative Strength Index (RSI) presents an interesting picture: Recent trading sessions show: Target: $0.24000-$0.25000 For a bullish reversal to materialize, DOGE needs to: If these conditions are met, the next major resistance levels lie at: DOGE/USD 2-hours chart - TradingView Range: $0.18650-$0.21000 The most likely scenario in the near term is continued consolidation: DOGE/USD 2-hours chart - TradingView Target: $0.17000-$0.18000 A breakdown below current support could lead to: DOGE/USD 2-hours chart - TradingView There is currently very little correlation between Elon Musk's mentions of his DOGE USD entity and Dogecoin. It seems as if the hype of Dogecoin faded from X, despite having a lot of famous X accounts named after DOGE. $DOGE $DOGECOINCurrent DOGE USD Price Overview
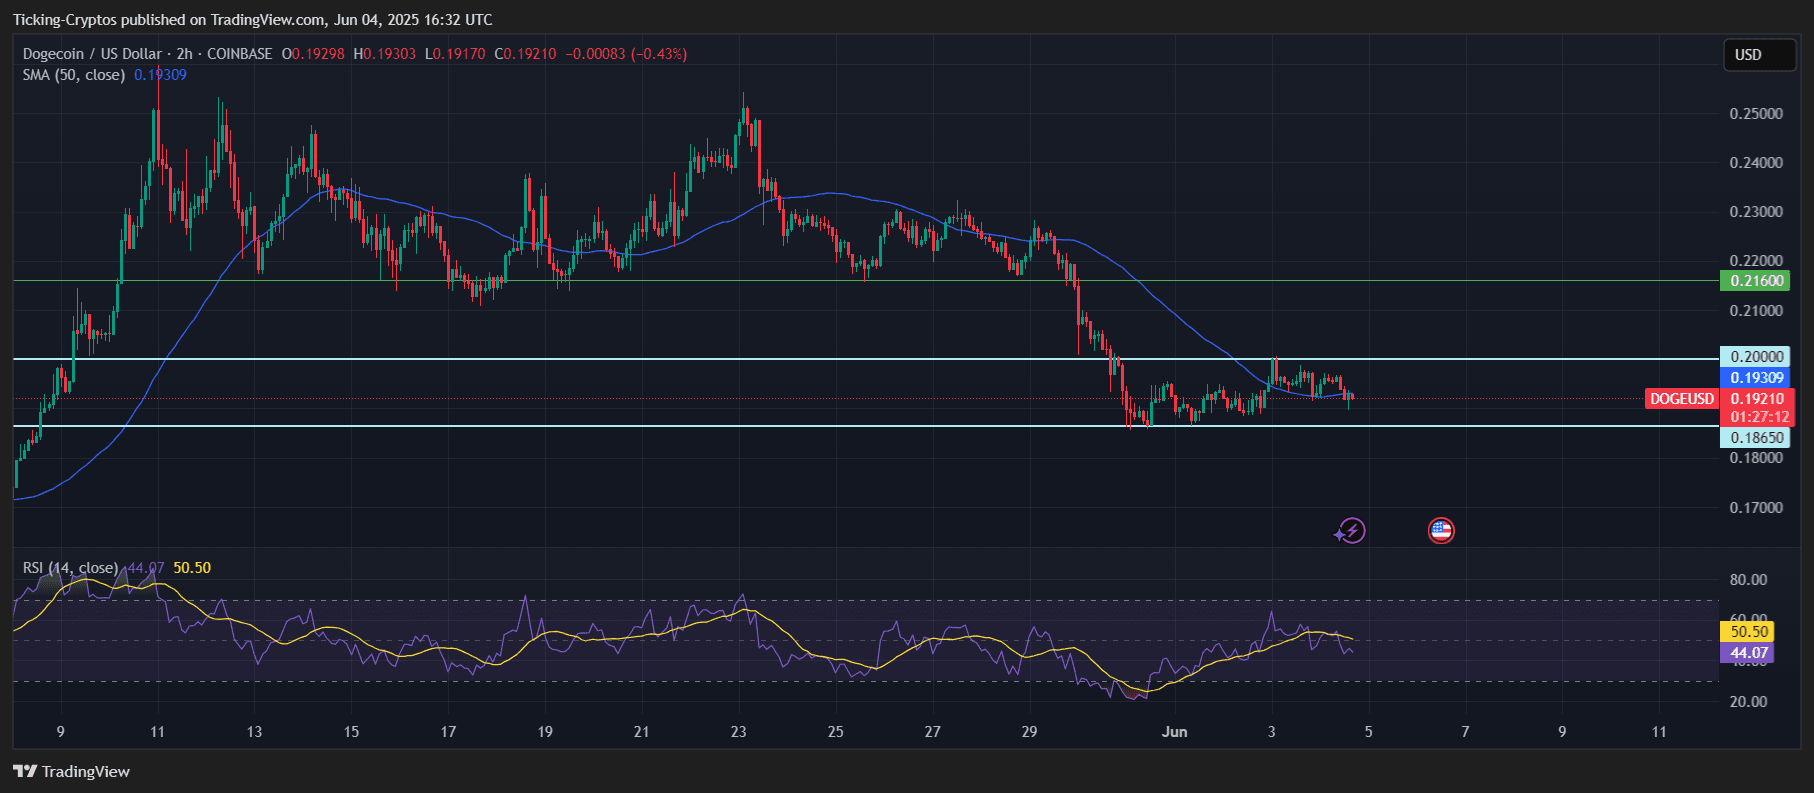
Technical Analysis: Key Observations
Price Action and Trend Structure
RSI Analysis
Volume and Market Structure
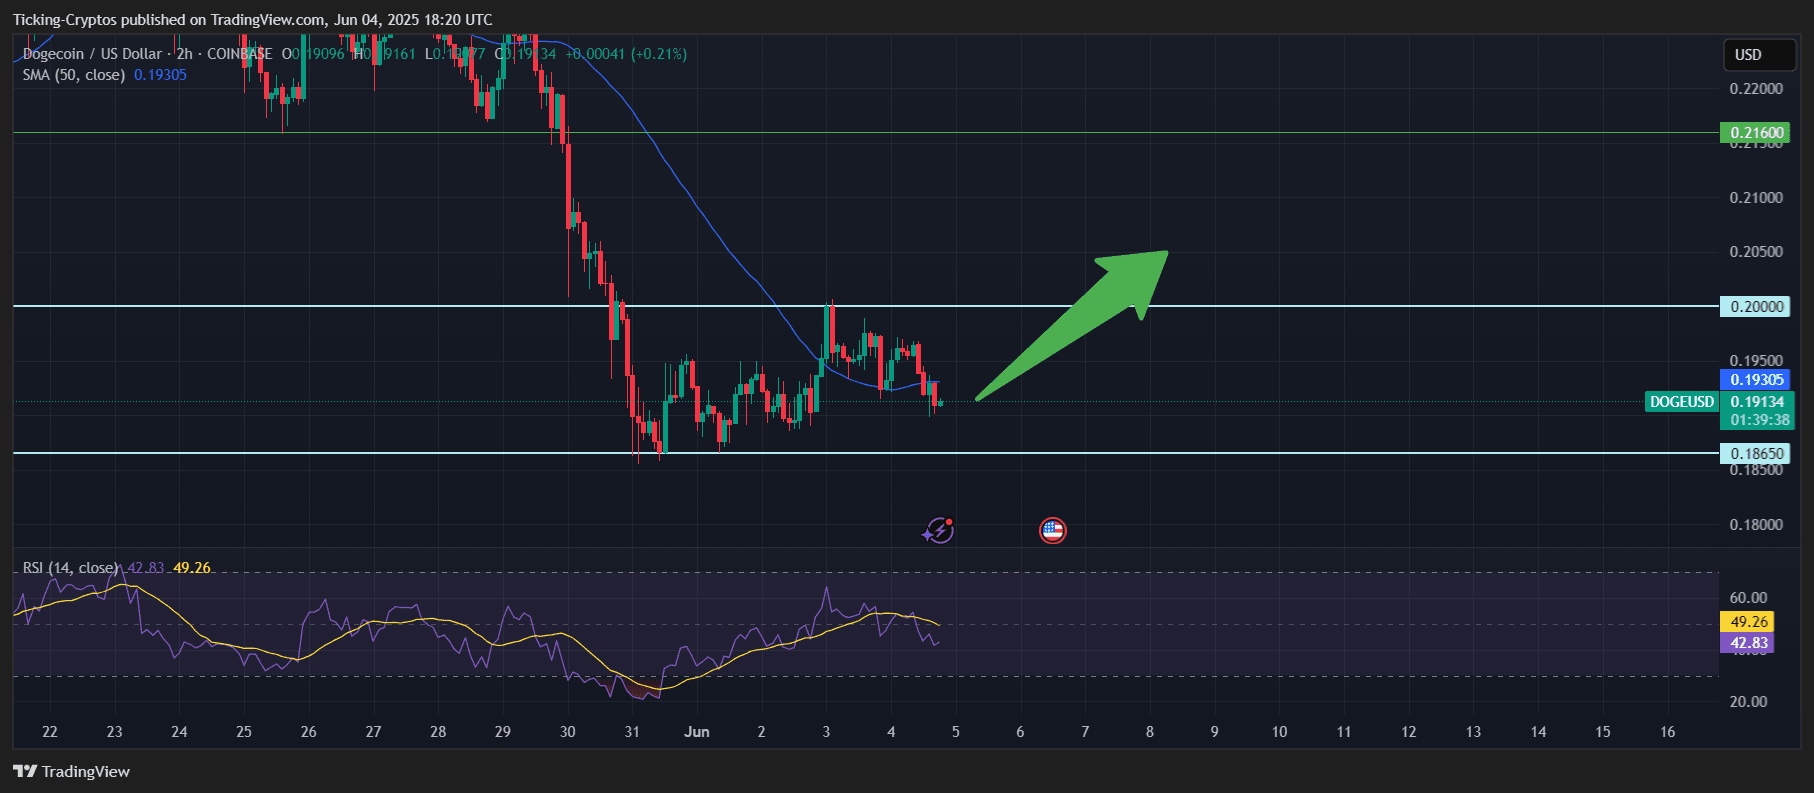
Dogecoin Price Prediction Scenarios
1. Bullish Scenario (40% Probability)
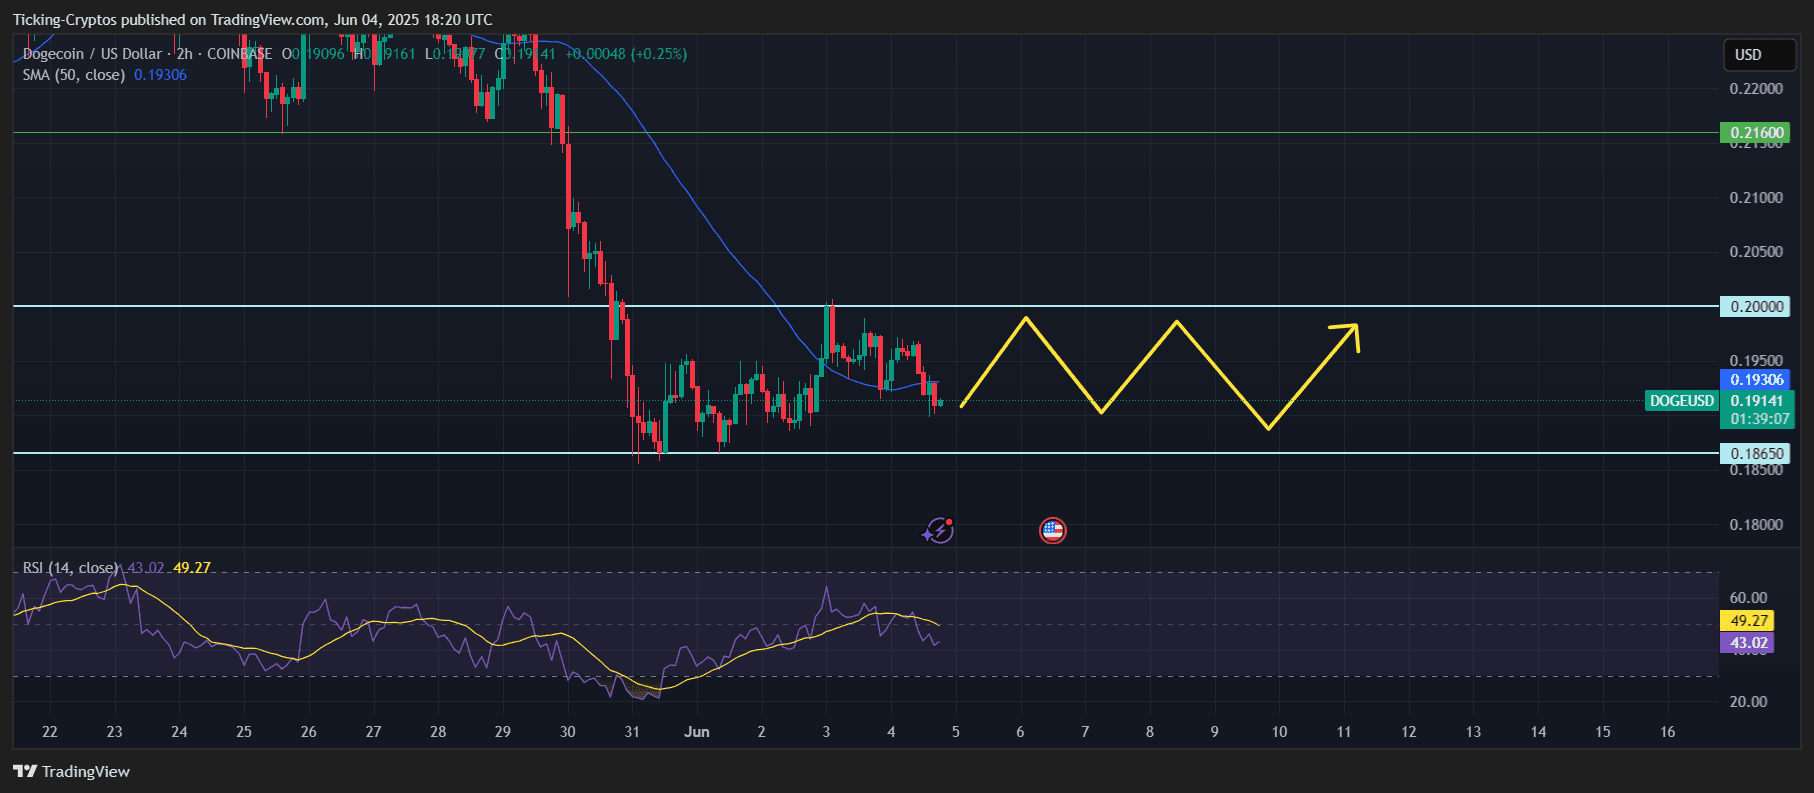
2. Neutral/Consolidation Scenario (45% Probability)
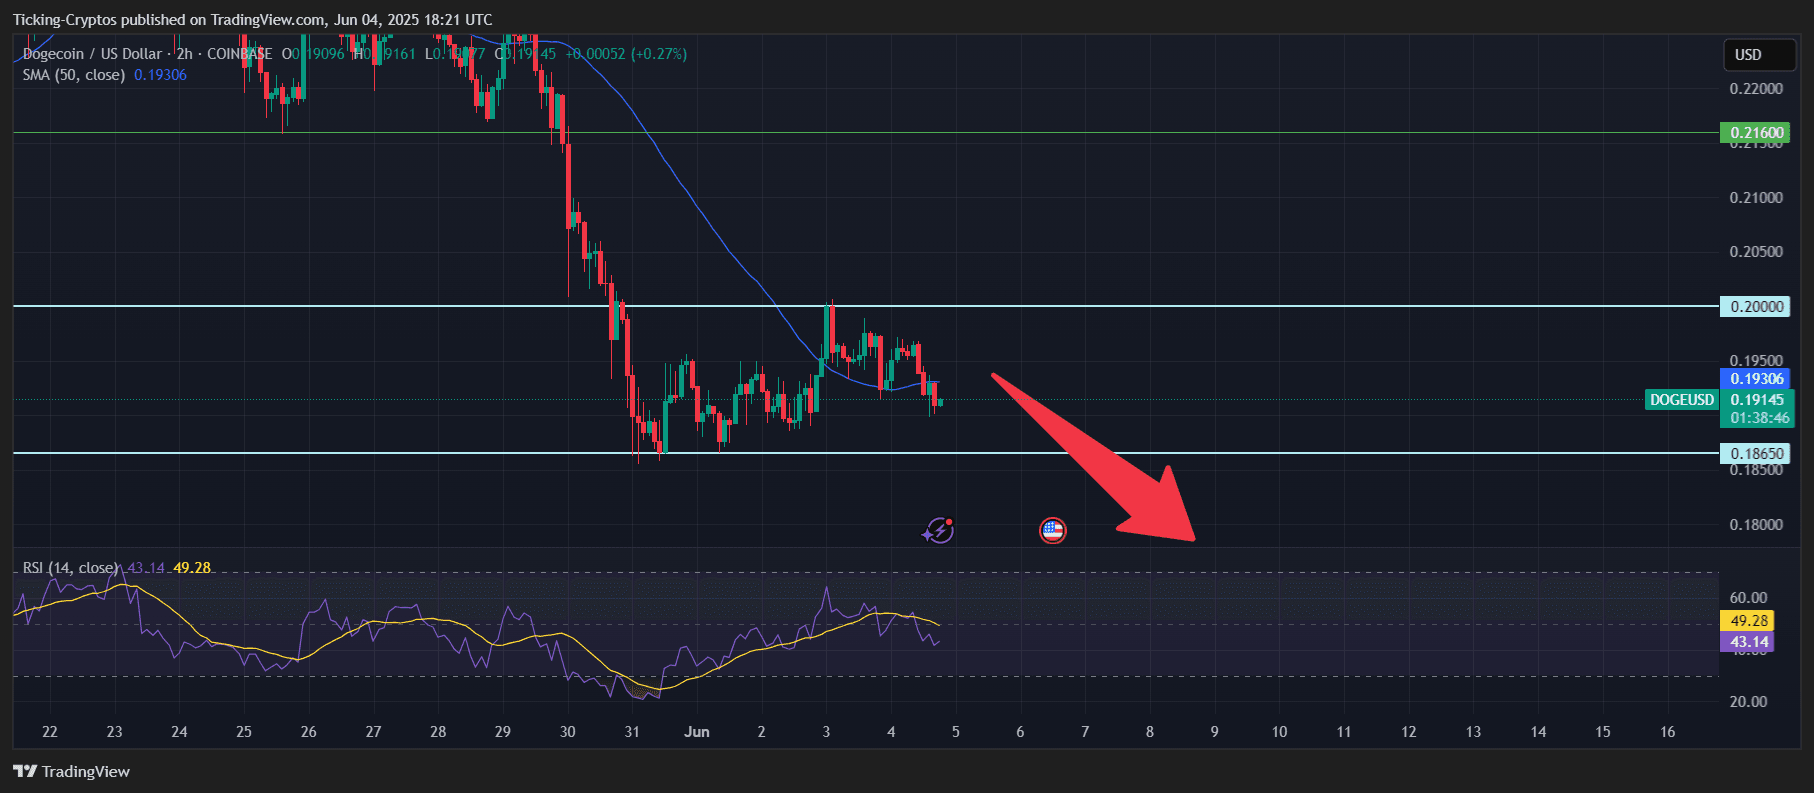
3. Bearish Scenario (15% Probability)
Key Factors Influencing Dogecoin USD Price
Market Sentiment Indicators
Technical Indicators to Watch
Trading Recommendations over the Short Term
Dogecoin Price Prediction: This Chart Signals BIG Recovery

