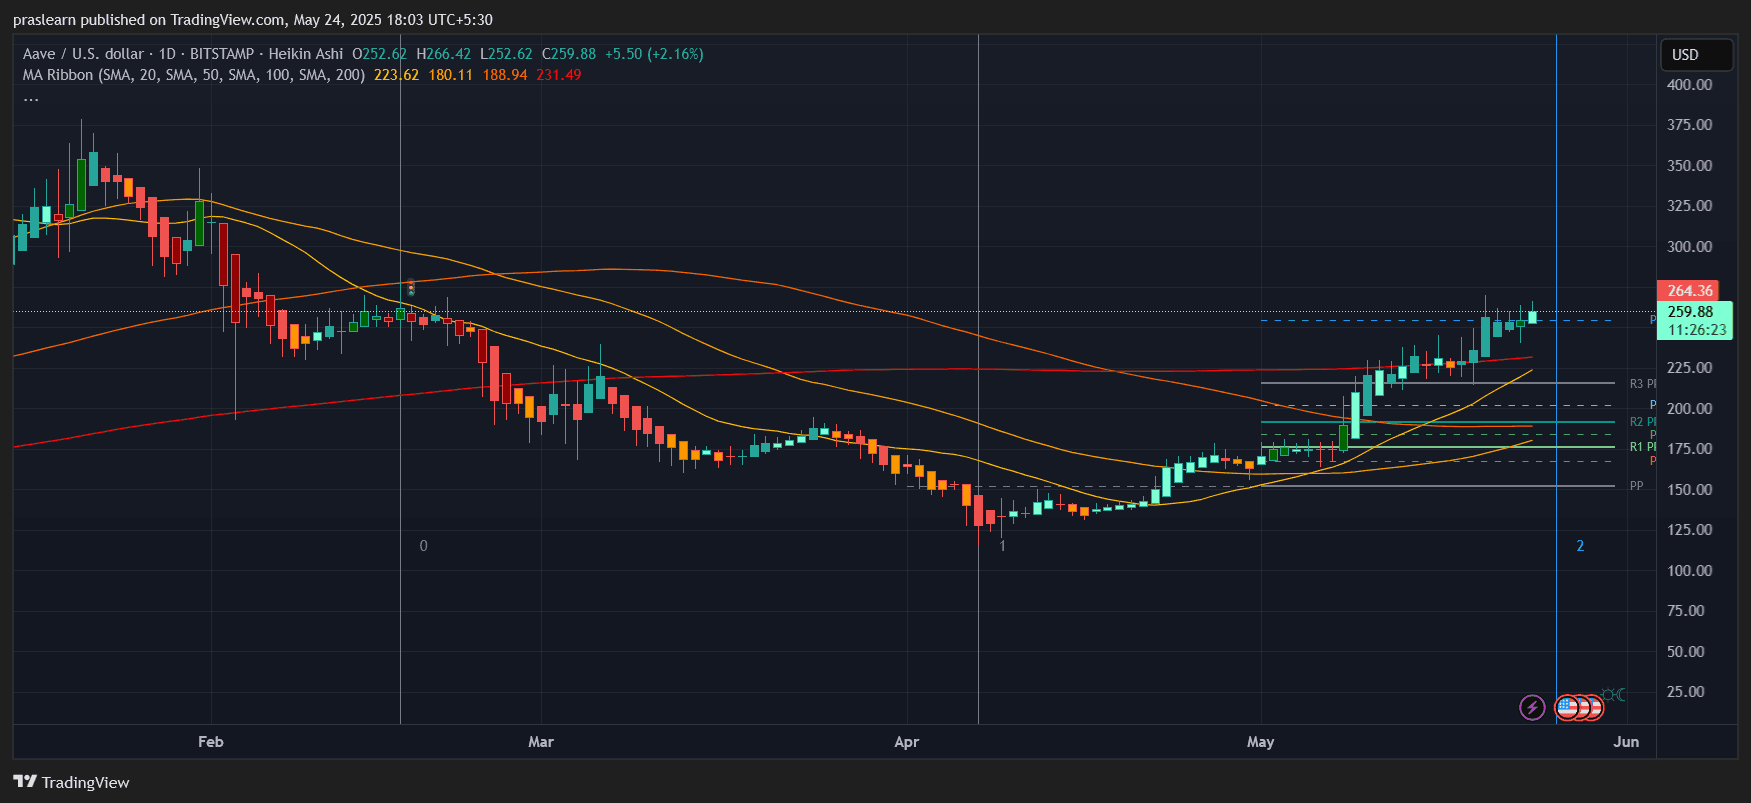
AAVE price is sending strong bullish signals on both the daily and hourly charts. After months of consolidation and decline, the recent breakout above key resistance levels hints at a potential trend reversal. Let’s decode the price action using the latest TradingView data and determine where Aave price might head next. The daily chart of AAVE price shows a robust breakout pattern. Price is currently trading at $259.88, up 2.16% on the day. More importantly, AAVE price has broken above its 100-day and 200-day moving averages, which are currently around $231.49 and $223.62, respectively. This move is technically significant as it marks a shift from bearish to bullish momentum. Notably, the moving average ribbon (20, 50, 100, 200 SMAs) is beginning to flip, with the shorter-term MAs now sloping upwards and preparing to cross over the long-term MAs. This MA compression and potential crossover is often seen before a sustained rally. The Heikin Ashi candles reflect strong bullish momentum with consecutive green bodies and no lower wicks, suggesting minimal selling pressure. The breakout above the horizontal resistance at $250–$255, now turned into support, gives bulls more control. Zooming into the hourly chart, AAVE price has been consolidating above its key short-term support at $257.52 (50 SMA) and $259.28 (20 SMA), forming a tight bullish flag. This consolidation, following a breakout, often precedes another upward impulse. Price touched a high of $264.75 and has pulled back slightly, now hovering around $264.27. If bulls manage to break and close above $265, the next key psychological and technical level is $280, followed by the $300 mark. The short-term price structure shows higher highs and higher lows, a textbook bullish formation. This structure, combined with price hugging the upper Bollinger Band and consistently testing resistance, confirms accumulation. Let’s break down the levels using Fibonacci and price structure: A quick Fibonacci extension from the recent swing low at $165 (early April bottom) to the swing high at $264 gives a 1.618 extension target at $305, lining up with the psychological $300 zone. Calculation: If Aave price maintains its hold above the $257–$260 range, it is likely to test $265–$270 early in the week. A breakout above $270 can accelerate the move toward $290–$300. The momentum is strong, but a failure to close above $265 may trigger a retest of $250. Given the bullish price action, upward-sloping moving averages, and strong market structure, the probability of testing $300 in the next 7–10 days is high, especially if broader market sentiment stays favorable. AAVE price appears to be in the early stages of a new bullish trend. The daily chart breakout, bullish structure on the hourly, and rising moving averages all suggest strength. As long as Aave price stays above $250, the bulls are in control. Short-term traders may target $280–$300, while long-term investors should watch for a retest of $231 as a strong buy-the-dip zone. A decisive daily close above $265 could unlock rapid upside potential, making now a critical time for AAVE watchers.Aave Price Prediction: What Does the Daily Chart Reveal?
What is the Hourly Chart Telling Us?
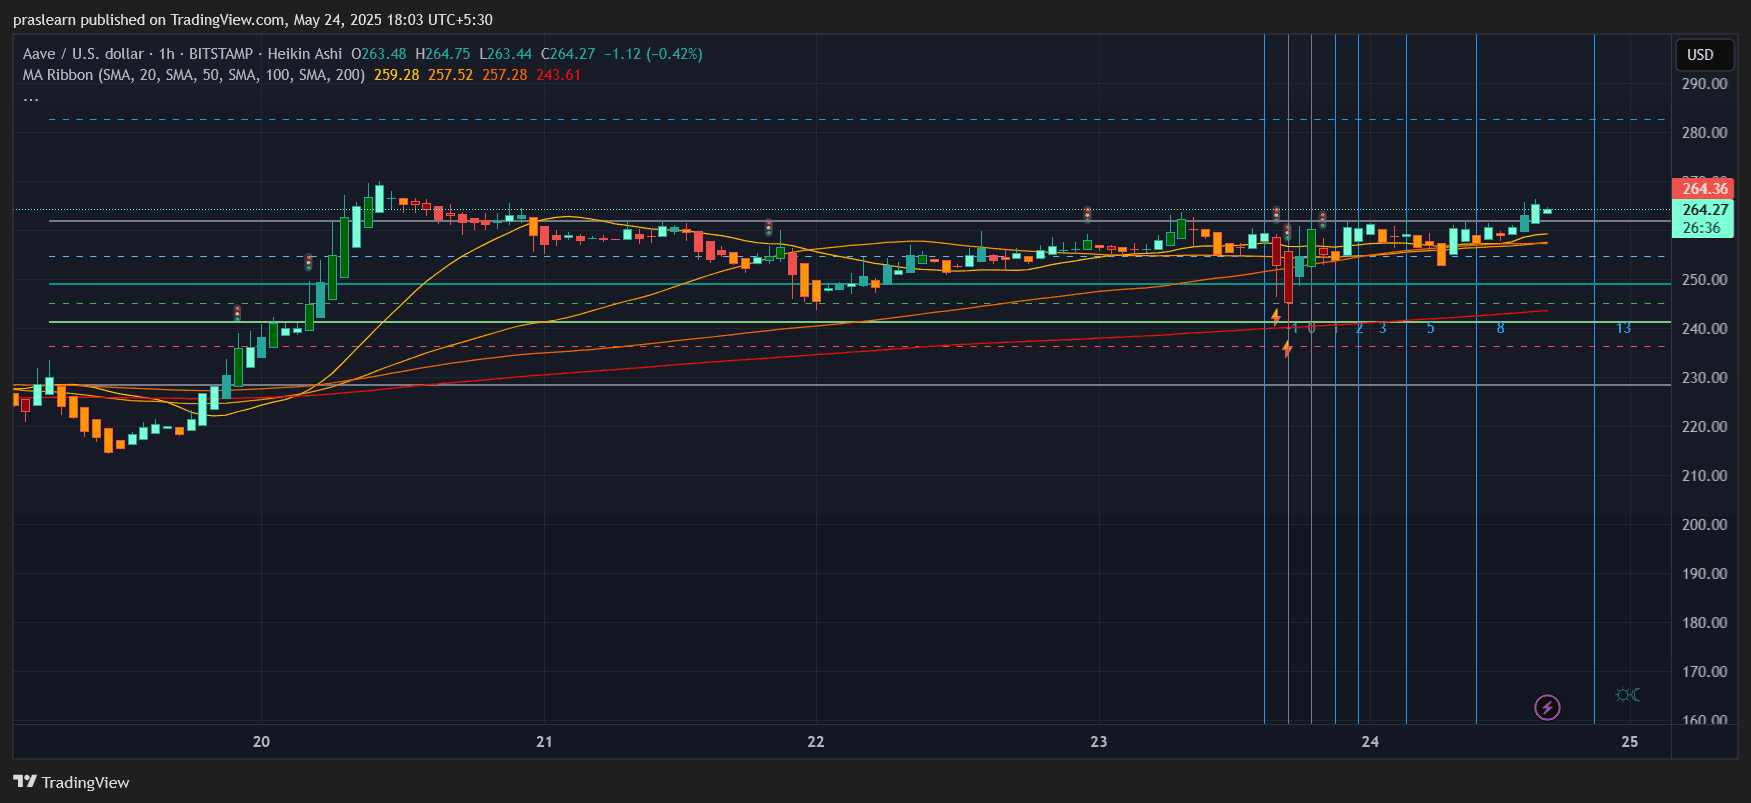
What Are the Key Levels to Watch?
$264 − $165 = $99 (swing range)
1.618 × $99 = $160.68
Target = $165 + $160.68 ≈ $325 (Aggressive bull target)
But conservative projection at 1.272 extension = $165 + (1.272 × $99) = $291What’s the Aave Price Prediction for the Next 7 Days?
Final Take: Is Now a Good Time to Buy AAVE?
Is AAVE the Next Big Altcoin Pump?

AAVE/USD Daily Chart- TradingView
AAVE/USD 1 Hr Chart- TradingView
