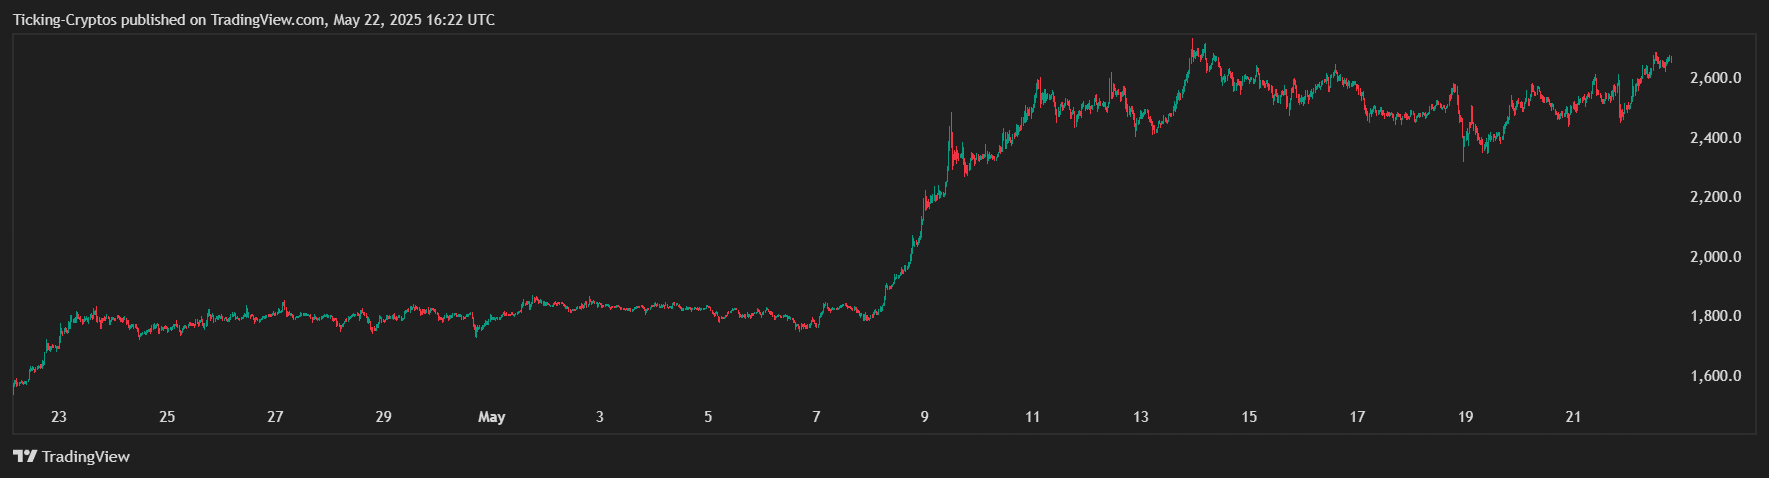
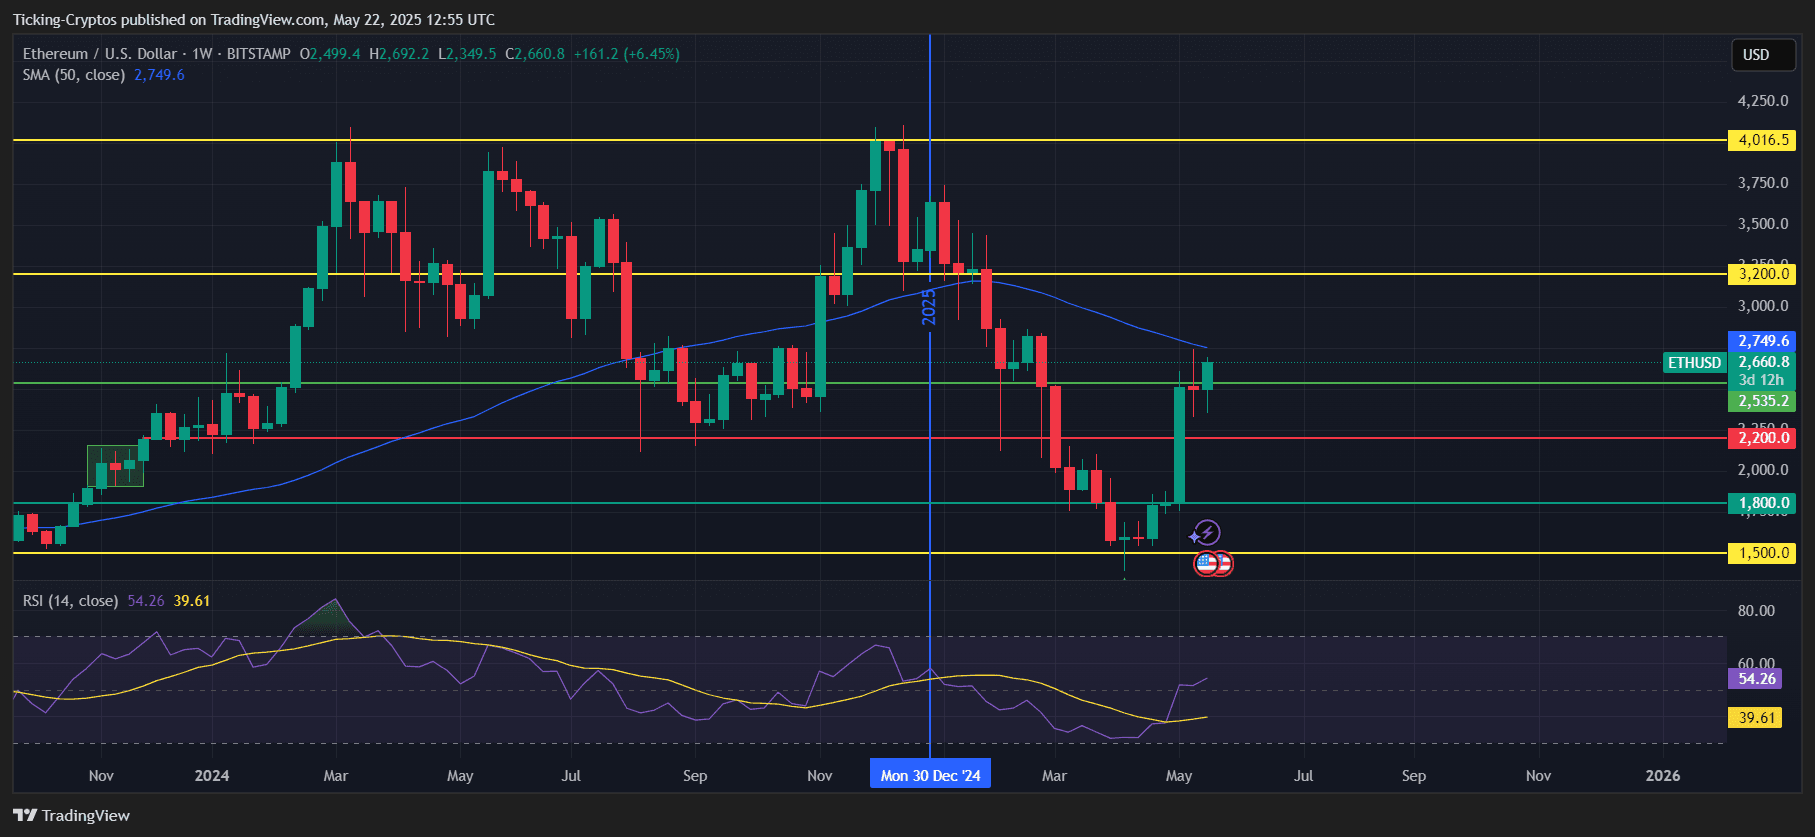
The Ethereum price has surged to $2,660, continuing a recovery trend supported by increasing market confidence. ETH is up 4.82% in the past 24 hours and 4.16% over the last 7 days, backed by growing trading volume and renewed investor interest. ETH/USD chart in the past 1-month - TradingView Ethereum now holds a market cap of $321 billion, with over $38 billion in 24-hour volume, signaling strong activity and momentum in the market. According to the weekly chart, Ethereum has broken above the $2,535 zone and is approaching the 50-week Simple Moving Average (SMA) at $2,749. This is a critical technical barrier. If ETH can close above this line, it could confirm a breakout from the months-long bearish structure. ETH/USD 1-week chart - TradingView The Relative Strength Index (RSI) is currently at 54.26, showing healthy momentum with more room for upside before reaching overbought levels. This supports the case for a potential continuation higher, especially if ETH holds above $2,535. Ethereum’s rise is part of a broader bullish wave across the crypto market, especially following Bitcoin’s new all-time high at $111K. Institutional capital is gradually flowing into altcoins, with Ethereum as the top pick after BTC. In addition, optimism around Ethereum’s upcoming scaling solutions, stronger Layer 2 adoption, and overall DeFi resurgence is pushing ETH back onto investors’ radar. As long as Ethereum stays above $2,535, bulls are in control. A close above $2,749 would unlock a path to $3,200, a level that has historically acted as a major resistance. However, a drop back below $2,535 could lead to a pullback toward $2,200, where a new base could form before another leg up.Ethereum News: ETH Price Climbs to $2,660 with Bullish Momentum
Ethereum Price Prediction: KEY Levels to Watch for Next Week
Key Ethereum Levels:
Technical Indicators Show Strength
What’s Driving the ETH Rally?
Can Ethereum Hit $3,200 Next?
Ethereum Price Prediction: KEY Levels to Watch for Next Week