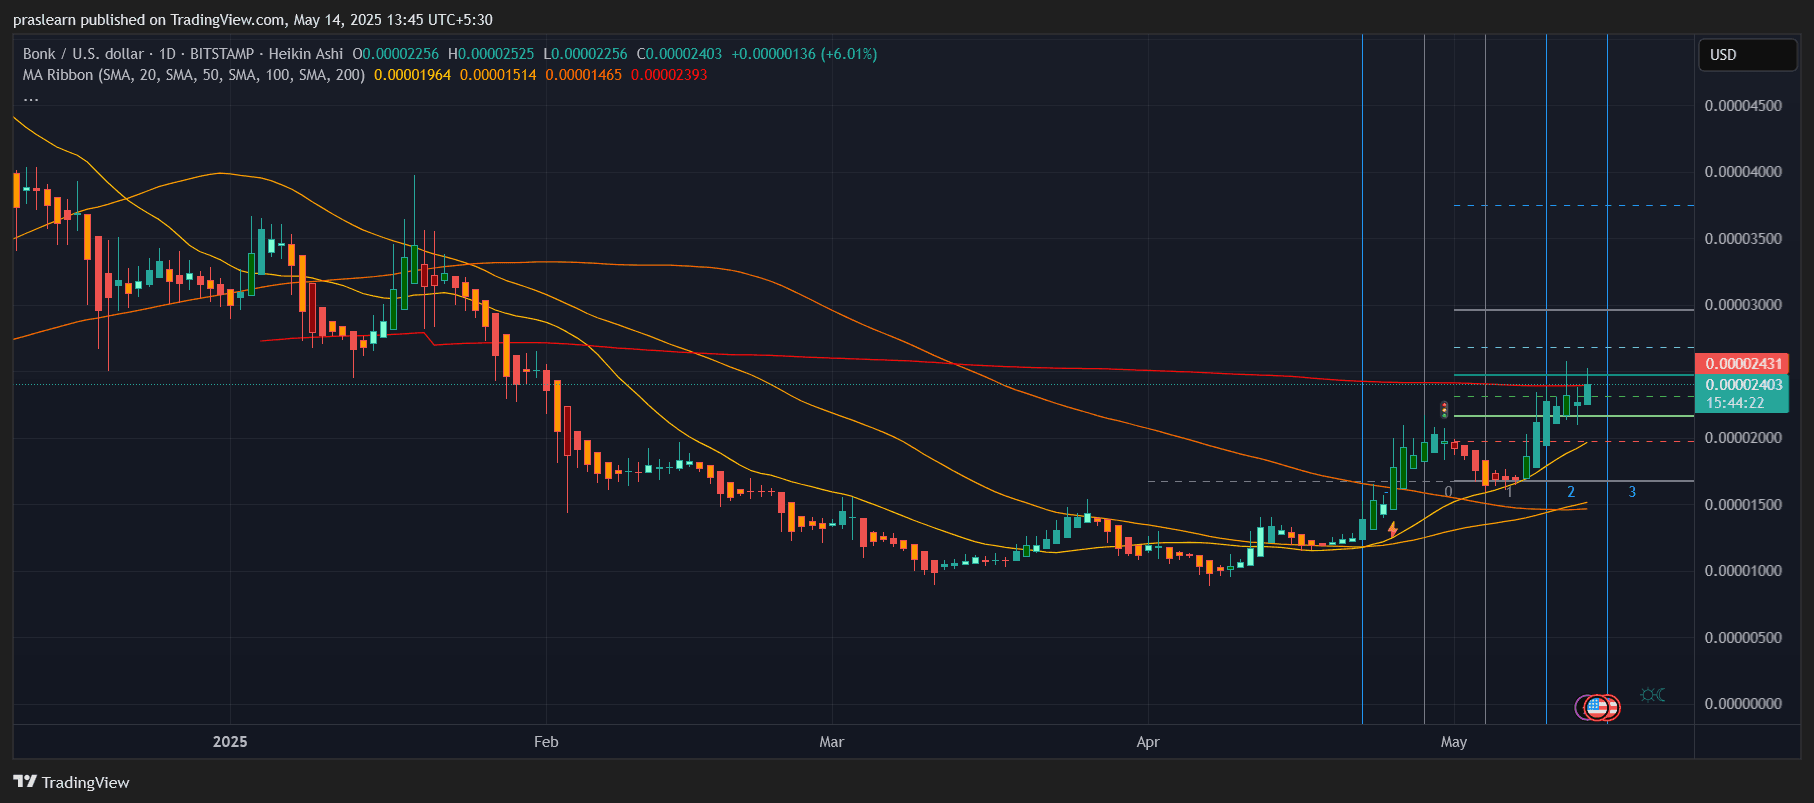
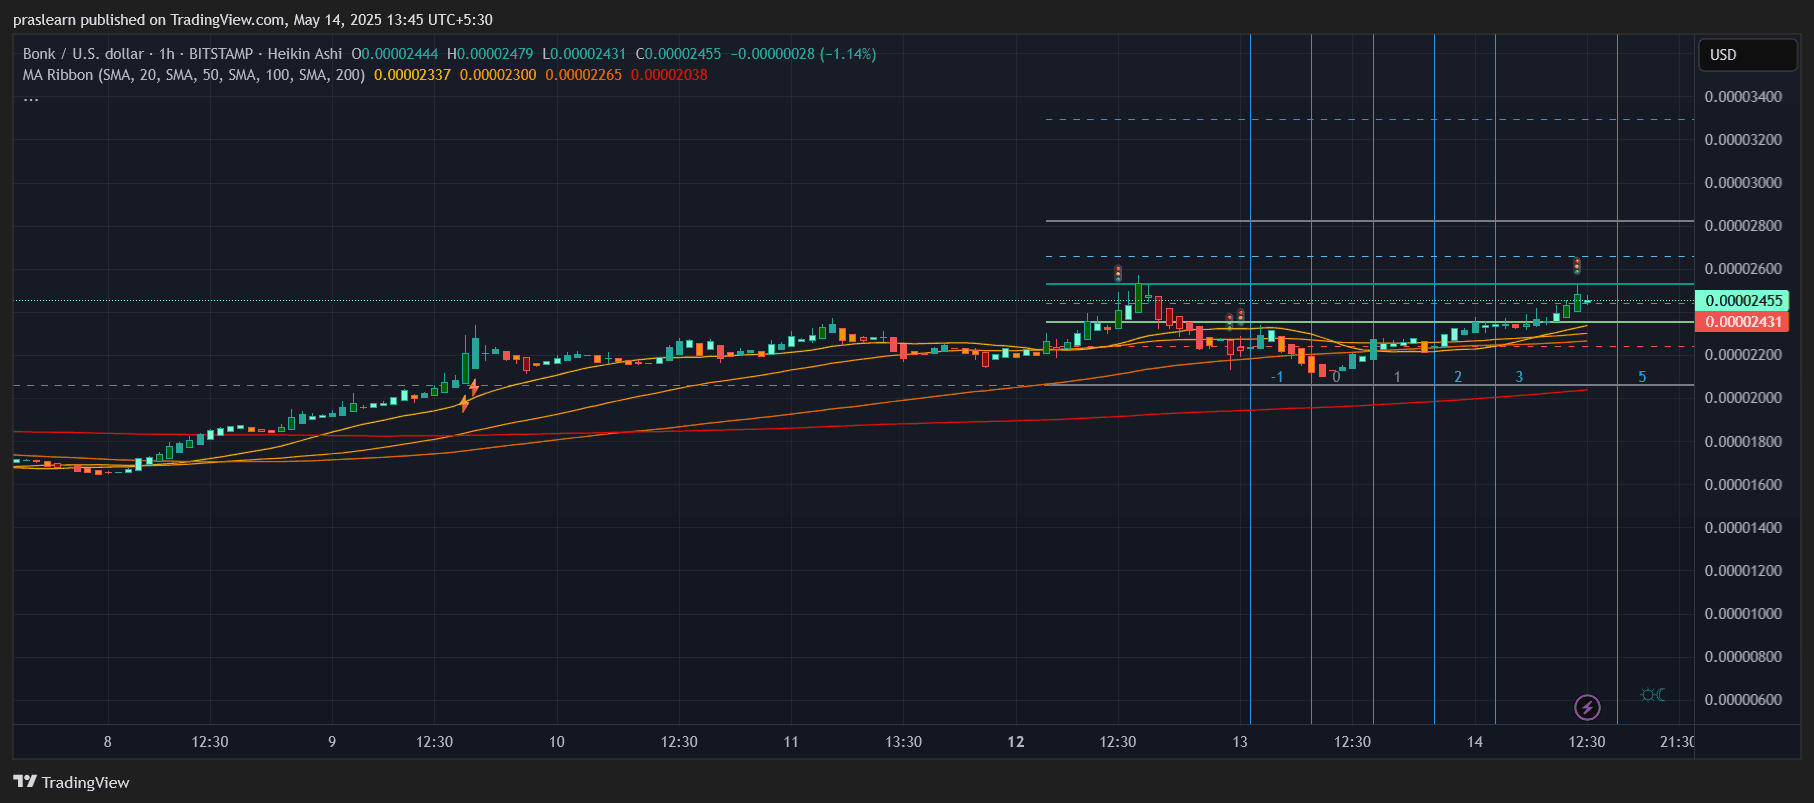
BONK price is back in the spotlight with an impressive rally, gaining momentum across both daily and hourly timeframes. With the meme coin market heating up again, traders are closely watching BONK for the next breakout move. Based on the latest chart analysis, BONK price is approaching a critical resistance zone, but the structure suggests more upside may be on the table. BONK has rallied over 60% from its local bottom of around $0.000015 to trade near $0.0000245. On the daily chart, the price has convincingly broken above the 50-day and 100-day SMA levels (which were major resistance earlier), confirming bullish sentiment. BONK is now trading above all key moving averages including the 200-day SMA at ~$0.0000239 — a strong long-term bullish indicator. This bullish crossover indicates a shift in momentum, often preceding larger moves. The price has respected the 20-day SMA as dynamic support since early May, indicating strong buyer interest on pullbacks. Yes, the hourly chart shows BONK consolidating just below key resistance at $0.0000258, which aligns with a previous high. A clean breakout above this level would open the doors to the next Fib extension zone around $0.0000283 and $0.0000300. Given BONK price measured move from the April low ($0.000013) to recent high ($0.000025), we can calculate the possible extension: $0.000025 - $0.000013 = $0.000012 (impulse move) Target = $0.000025 + $0.000012 = $0.000037 A breakout with strong volume could send BONK as high as $0.000037, though that would require broader meme coin enthusiasm and Bitcoin stability. From a technical perspective: If BONK price fails to break resistance at $0.0000258, a retest of the following support levels is possible: A breakdown below $0.000020 would invalidate the current bullish structure and signal a correction phase. If BONK price maintains its current trajectory and breaks into price discovery, expect a move toward $0.000035–$0.000037, supported by meme coin speculation and favorable macro crypto sentiment. BONK is flashing a strong bullish setup on both daily and hourly charts. A breakout above key resistance could spark a quick rally toward $0.00003 and beyond. But traders should watch for rejection at key levels and manage risk accordingly.BONK Price Prediction: Why Is BONK Price Rising Now?
Is BONK Gearing Up for a Breakout?
Fibonacci Extension Targets:
What’s Supporting BONK’s Uptrend?
Key Support Levels to Watch
BONK Price Prediction: What’s Next?
Short-Term Forecast (Next 3–7 Days)
BONK Price Prediction: Mid-Term Outlook (May 2025)
BONK Price Prediction: Big Move Ahead?

BONK/USD Daily Chart- TradingView
BONK/USD 1 Hr Chart- TradingView
