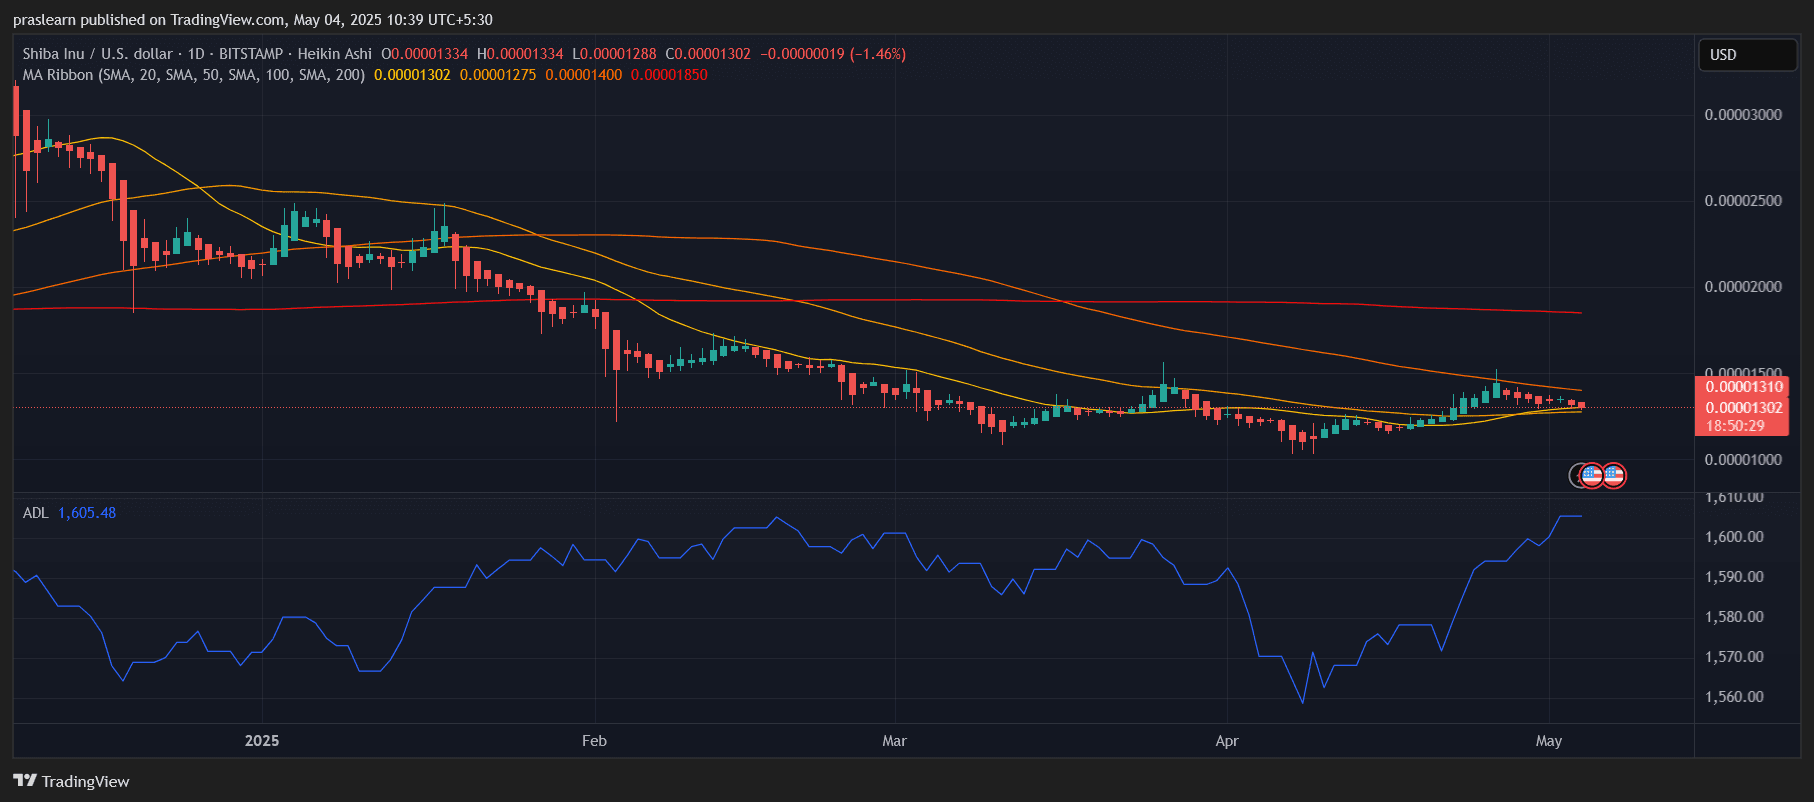
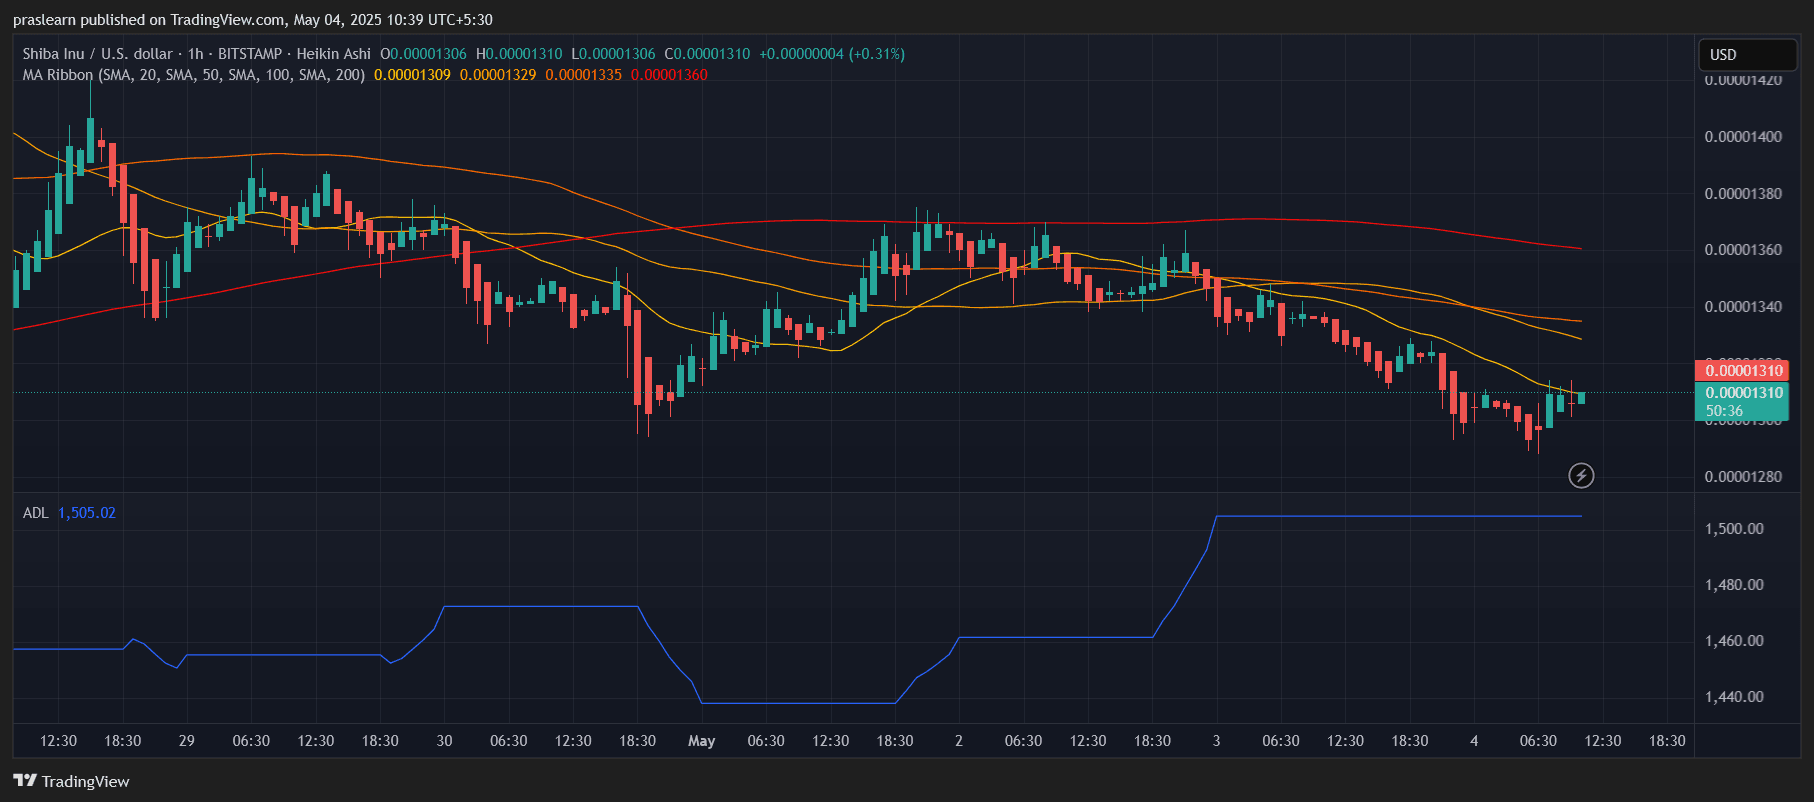
Shiba Inu (SHIB), the self-proclaimed “Dogecoin killer,” has long captured investor imagination with dreams of hitting the elusive $1 mark. With May 2025 underway, SHIB price has shown subtle but noticeable shifts in momentum. But are these enough to spark a rally to $1, or are we staring at another meme-driven mirage? Let’s dive into the charts and indicators to uncover what Shiba Inu Price is actually signaling. On the daily chart, SHIB price is trading near $0.00001310, stuck in a narrow range with downward Heikin Ashi candles indicating waning bullish pressure. It's currently riding just above the 20-day simple moving average (SMA) at $0.00001302, showing a tentative hold on short-term momentum. However, the 50-day SMA at $0.00001275 and 100-day SMA at $0.00001400 are closing in, suggesting a compression zone forming — a classic precursor to a breakout or breakdown. The 200-day SMA at $0.00001850 still looms far overhead, representing a major long-term resistance zone. The narrowing gap between these moving averages is creating a triangle-like squeeze that typically resolves with high volatility. Volume remains muted, indicating traders are waiting for a trigger. Watch closely for a breakout above $0.00001450, which could clear a path toward $0.000018, a key level not seen since March. Zooming into the hourly chart, SHIB price has attempted a mild recovery after dipping below $0.00001300 on May 3. The price bounced from $0.00001280 and has since reclaimed the 50-hour SMA, currently at $0.00001329. However, resistance at the 100-hour SMA ($0.00001335) and 200-hour SMA ($0.00001360) is proving stiff. Unless SHIB closes convincingly above $0.00001350 on the hourly timeframe, the bounce could fade. On the flip side, support around $0.00001280 remains strong and has acted as a launchpad twice in the past 48 hours. The Accumulation/Distribution Line (ADL) is showing a steady rise, hinting that accumulation is quietly ongoing despite flat price action. This divergence often precedes a bullish move. The slope of the moving averages and the recent flattening of the ADL line suggest consolidation. However, this isn’t necessarily bearish — in fact, sideways movement after a recovery is often a sign that bulls are building strength. If SHIB can flip the 100-day SMA at $0.00001400 into support, we could see a quick run toward $0.000018, followed by $0.000022 if momentum accelerates. But realistically, the notion of reaching $1 in May is still far-fetched. For that to happen, SHIB price would need an exponential gain of 7.6 million percent — which would require either a global fiat collapse or every central bank replacing their currency with Shiba Inu. Neither is likely. Shiba Inu price is holding its ground despite facing stiff resistance across multiple moving averages. The technical indicators show potential for a breakout, but volume and market sentiment need to align for any significant move. While $1 remains more meme than reality, a rally toward $0.000018–$0.000022 isn’t out of the question if bulls push past near-term resistance. In short, SHIB might not reach the moon this May, but it could still deliver a solid ride — especially for short-term traders watching the $0.000014 breakout zone.Shiba Inu Price Prediction: Bullish Build-Up or Resistance Trap?
Hourly Chart Insights: Short-Term Bounce in Play
Momentum Check: Is SHIB Preparing for a Breakout?
Shiba Inu Price Prediction: Key Levels to Watch
What’s Next for SHIB in May?
Will Shiba Inu Price Reach $1 in May?
SHIB/USD Daily Chart- TradingView
SHIB/USD 1 Hr Chart- TradingView
