
The July 2008 to March 2025 S&P 500 vs. ISM PMI chart showed that ISM PMI rose to at least 44 in late 2024 from 48 as of March 2025, showing expansion in US manufacturing activity.
Previously, S&P 500 tracking trends of ISM PMI rose from 1,330 to 2,660 when PMI rose from 48 to 56 between 2010-2014 and rose from 1,330 to 5,320 when PMI rose further to 64 between 2020-2024.
This recent 44-48 spike follows a similar rebound earlier with a positive comment.
This could suggest, subsequently, the crypto markets could also be set for a rebound.
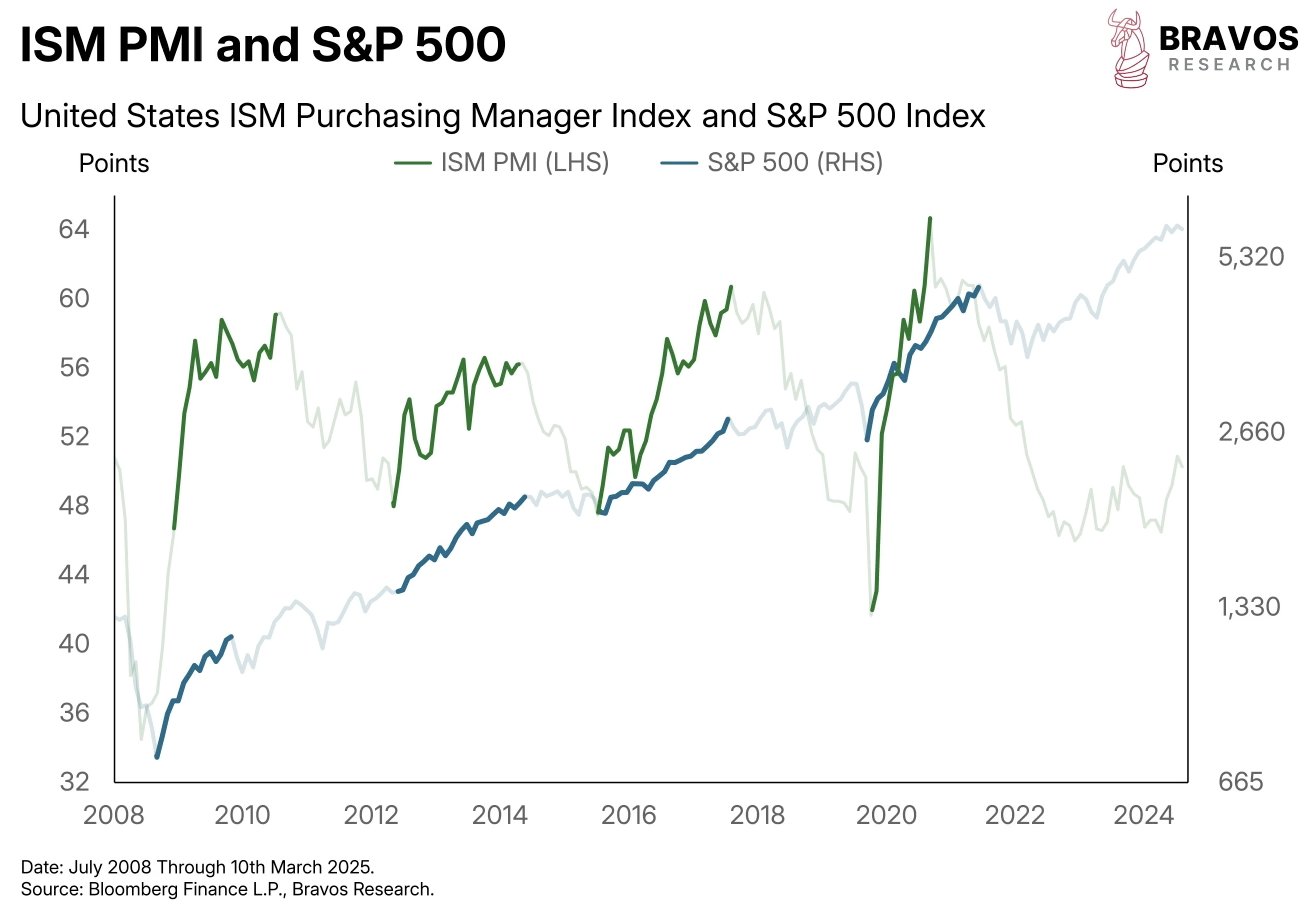
This would need to be met with an S&P 500 recovery to 5,320 or higher if PMI is well above 52 on the foundation of prior structure breaks.
But when PMI drops below 44, however, a bear market is possibly in play, taking the S&P 500 down to 2,660 or below, on the basis of a bearish reversal.
The recent PMI rebound at 48, from prior correlation, is favorable for a rally in the market.
However, it fails if not sustained above 48, as the gains are reversed, going lower.
Bitcoin Liquidates Short Traders
The Bitcoin Aggregated Liquidation Levels Heatmap (3 days) showed intense short-position liquidations occurred in the $80K to $90K region when Bitcoin hit its March high of $90K and dropped to $85K.
The right-side liquidation chart also shows huge short-position liquidations in the range $85K to $90K worth $200 Million, despite long-position liquidations being extremely low at $20M.
The peak in short-term liquidations was seen on March as can be seen from the lower chart where the net levels of short and long positions showed a red spike worth $158 Billion and negative pressure turning positive.
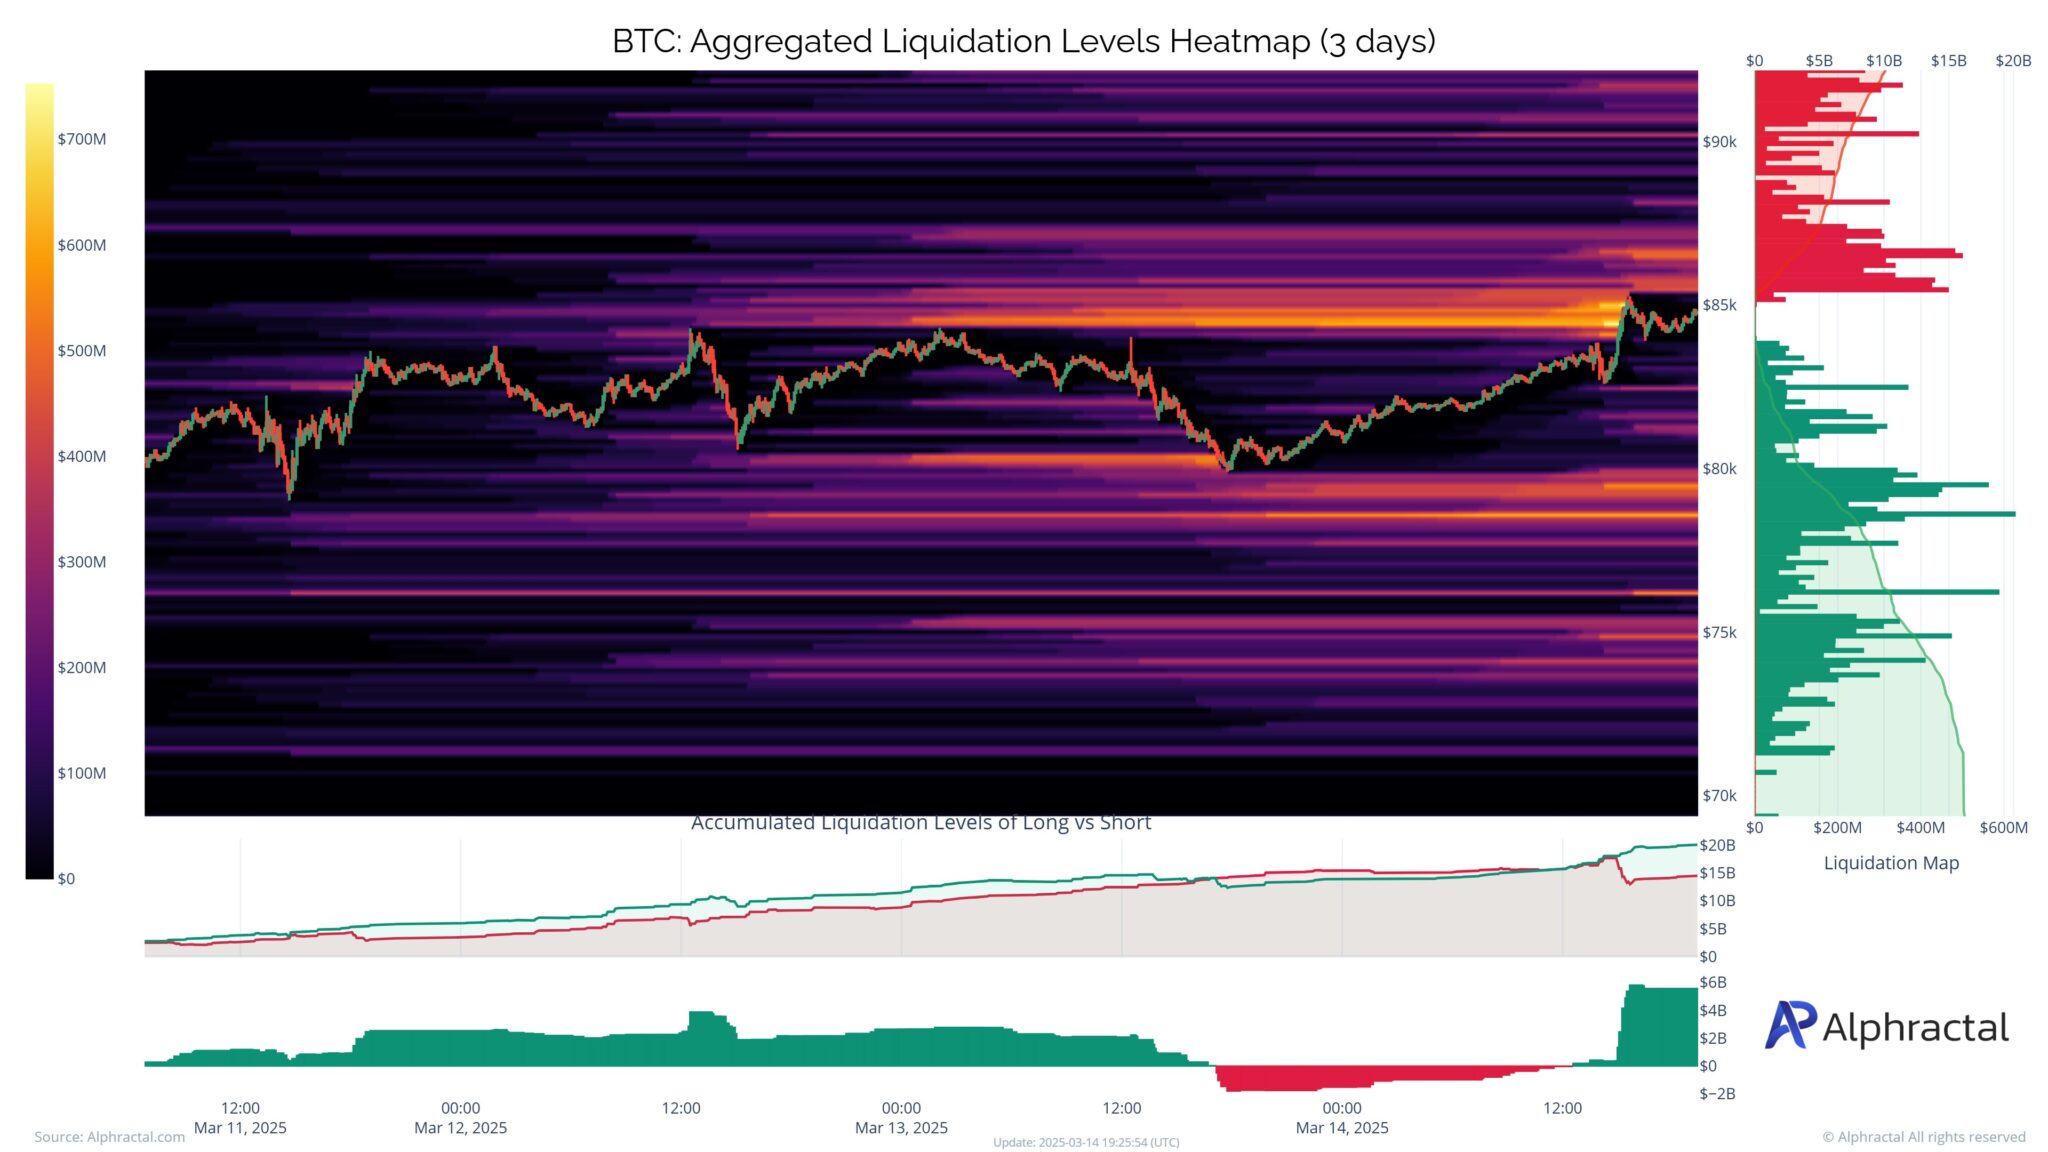
Bitcoin might go above $90K or even higher levels when the buying pressure remains above the $158B level.
A rise in price above $90K will establish a bullish trend that would direct BTC towards $108K.
Selling pressure will further prolong the downtrend if it rises to reduce market value below the $80K level. The initial support is at $75K.
The present bull trend in the market is good for Bitcoin at the moment.
However, a breakdown at $80K would signal traders about potential bearish inclinations that would definitely initiate further falls.
Potential $3B Liquidity Sweep
Bitcoin Exchange Liquidation Map over the last month showed $84K had big liquidation values at $76K.
The total long liquidation leverage of $3.08 Billion at $76K was from Binance ($1.89M), OKX ($4.63M), and Bybit ($49.06M). Total short liquidation leverage is $99.05 Million across $99K.
If BTC goes back to $76K then the $3.08 Billion of long liquidations could trigger an enormous liquidity sweep.
Most likely, it would cause a clean drop as positions are closed out leveraged, potentially taking BTC to $71K.
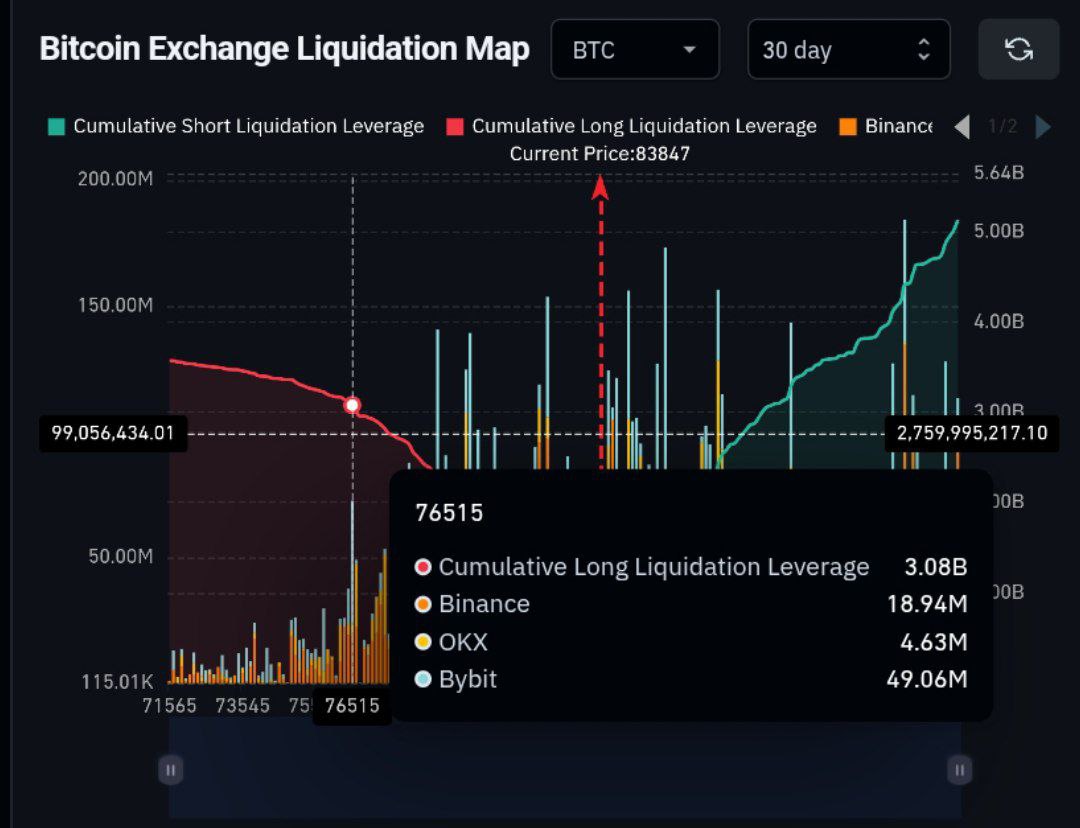
That would invalidate the current bullish setup for the crypto market, meaning a turn to bearish.
If, however, BTC sustains above $84K and bursts through $99K, then the $99.05 million worth of short liquidations can fuel a rally toward a target of $115.01K.
