
Dogecoin (DOGE) price decline signals a potential falling wedge breakdown, with a sharp correction potentially pushing the price to $0.13
As the crypto market slides back to pre-crypto reserve announcement levels, Dogecoin witnessed a pullback of 16%. As the declining trend continues, Dogecoin has breached the $0.20 psychological mark with an intraday pullback of 2.80%.
Currently, the biggest meme coin, with a market cap of $28.64 billion, is trading at $0.1931. Will this declining trend lead to a retest of the $0.13 support level? Let’s explore.
Dogecoin Price Crashes Under $0.20
On the daily chart, DOGE’s price trend shows a significant surge of 15.80% on Sunday after the U.S. crypto reserve announcement. However, the onset of tariff wars between the U.S. and other nations triggered a broad crypto market crash.
Dogecoin plunged by 16.78%, erasing the weekend recovery, and is now trading below the 50% Fibonacci level at $0.20. With a 24-hour low of $0.1854, Dogecoin is testing the local support trendline of a falling wedge pattern.
As the decline continues, the 50 and 200 EMA lines are converging, signaling the potential for a death cross event. Furthermore, the daily RSI is returning to the oversold territory, reflecting weakening buying pressure. These technical indicators point to a potential falling wedge breakdown rally.
Growing Bearish Positions in Futures
The futures market is witnessing a significant shift, with the long-to-short ratio now at 0.9361, indicating more short positions. Meanwhile, the funding rate is at -0.0013%, showing that sellers are paying a premium to the bulls.
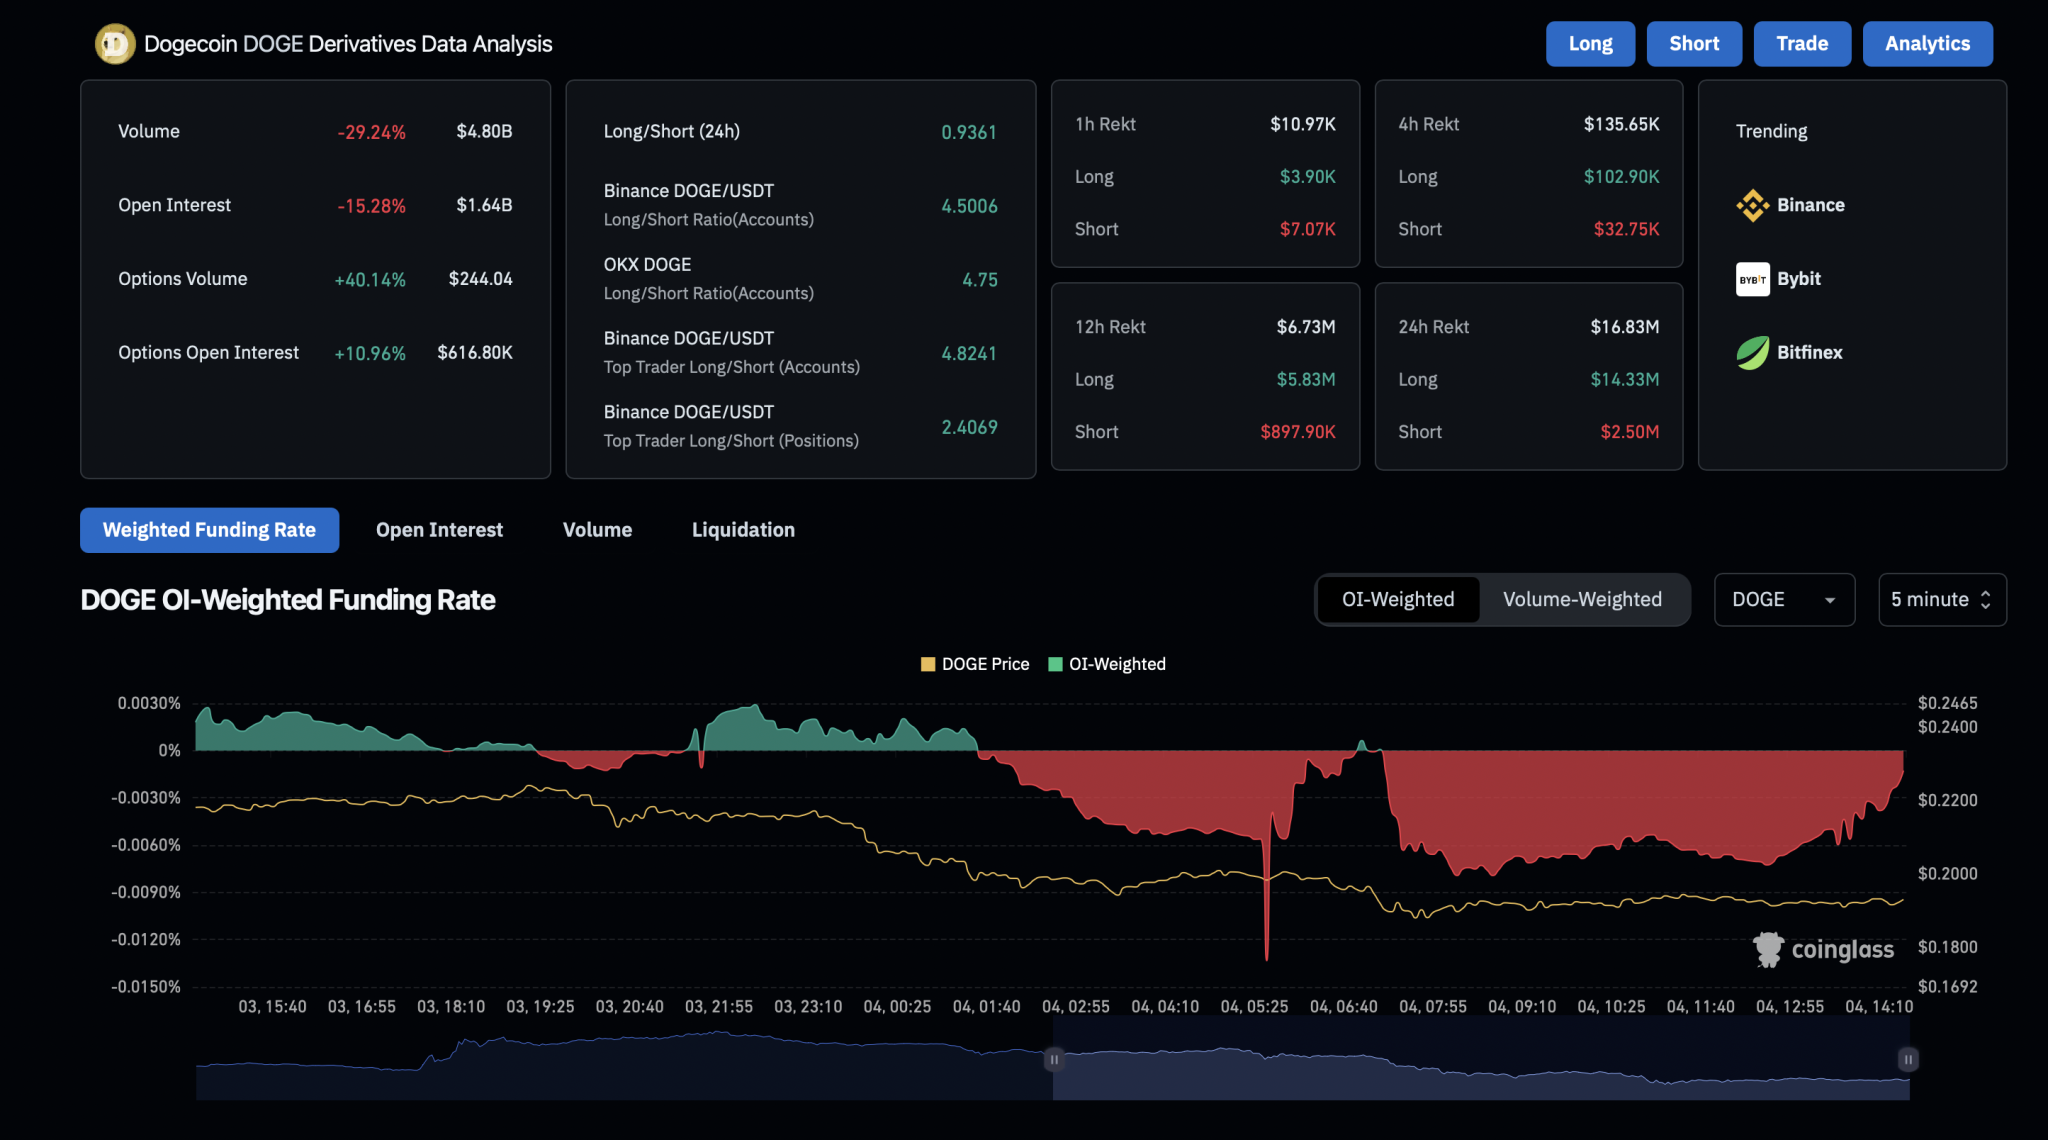
Currently, the open interest in Dogecoin has dropped by 15.28% to $1.64 billion. In the past 24 hours, $16.83 million worth of Dogecoin positions have been liquidated, with long liquidations accounting for $14.33 million.
Key DOGE Price Targets
According to Fibonacci levels, a potential breakdown of the falling wedge pattern could test the 23.60% Fibonacci level at $0.1315. However, if an unlikely recovery occurs, the overhead resistance levels are at $0.20 and $0.25, near the 200-day EMA line.
