For many investors, 2025 seems like an extremely bullish year for the broader crypto market. But on the first day, Bitcoin (BTC) faces intense selling pressure on day one, which has raised concerns about the flagship cryptocurrency’s ability to break above $95,000.
In this analysis, BeInCrypto examines Bitcoin’s short-term price outlook using key indicators.
Bitcoin Investors Put Sustained Uptrend in Doubt
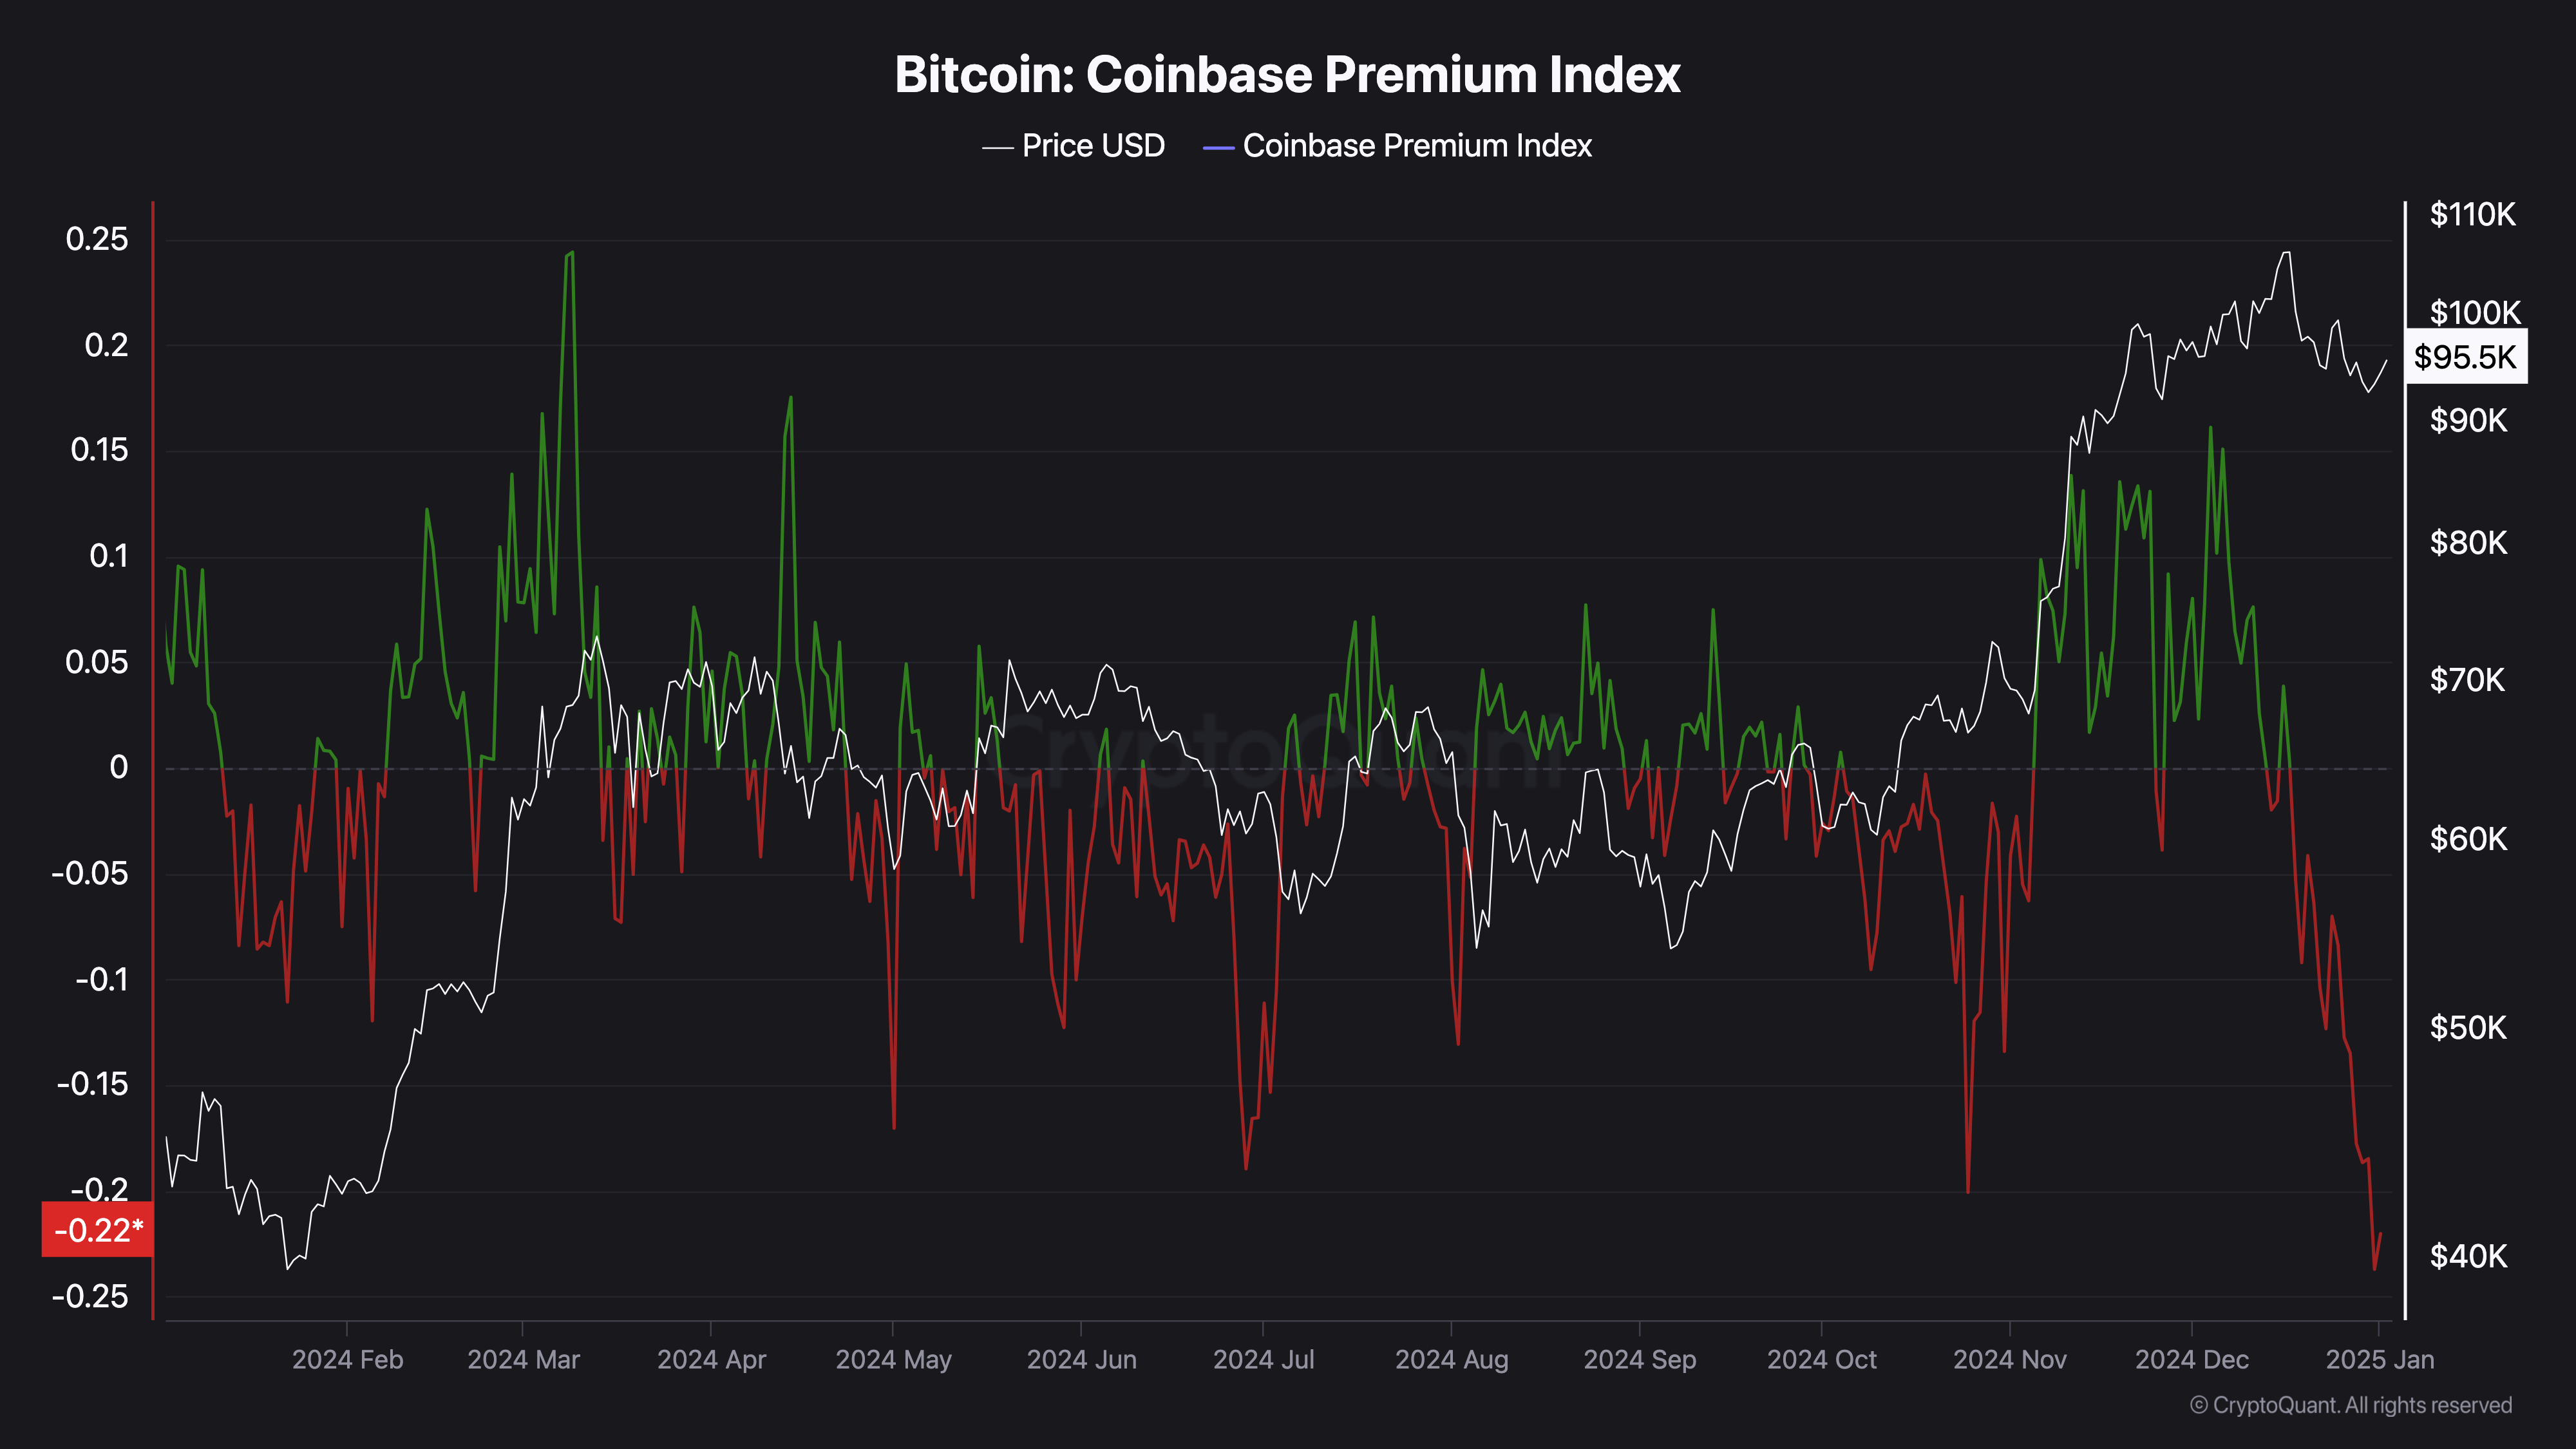
After the US elections in November 2024, the Bitcoin Coinbase Premium Index climbed to 0.14. The Coinbase Premium Index measures whether there is strong buying pressure among US investors or whether they are selling in large volumes.
High values, like those in November, indicate strong selling pressure. However, as of this writing, the index has dropped to -0.22, the lowest level in the last 12 months. This significant decline indicates that Bitcoin investors in the US are selling their assets.
Despite that, Bitcoin price trades at $95,318, representing a mild 2.06% increase in the last 24 hours. However, should these investors continue to let go of their BTC, this trend might change, and the price of cryptocurrency might slide lower.

Following this development, crypto analyst Burak Kesmeci noted that it could become difficult for the Bitcoin price to climb.
“Such trends can create a challenging environment for Bitcoin’s short-term price recovery unless we see a shift in macroeconomic conditions or renewed interest from institutional or retail buyers,” Kesmeci opined via CryptoQuant.
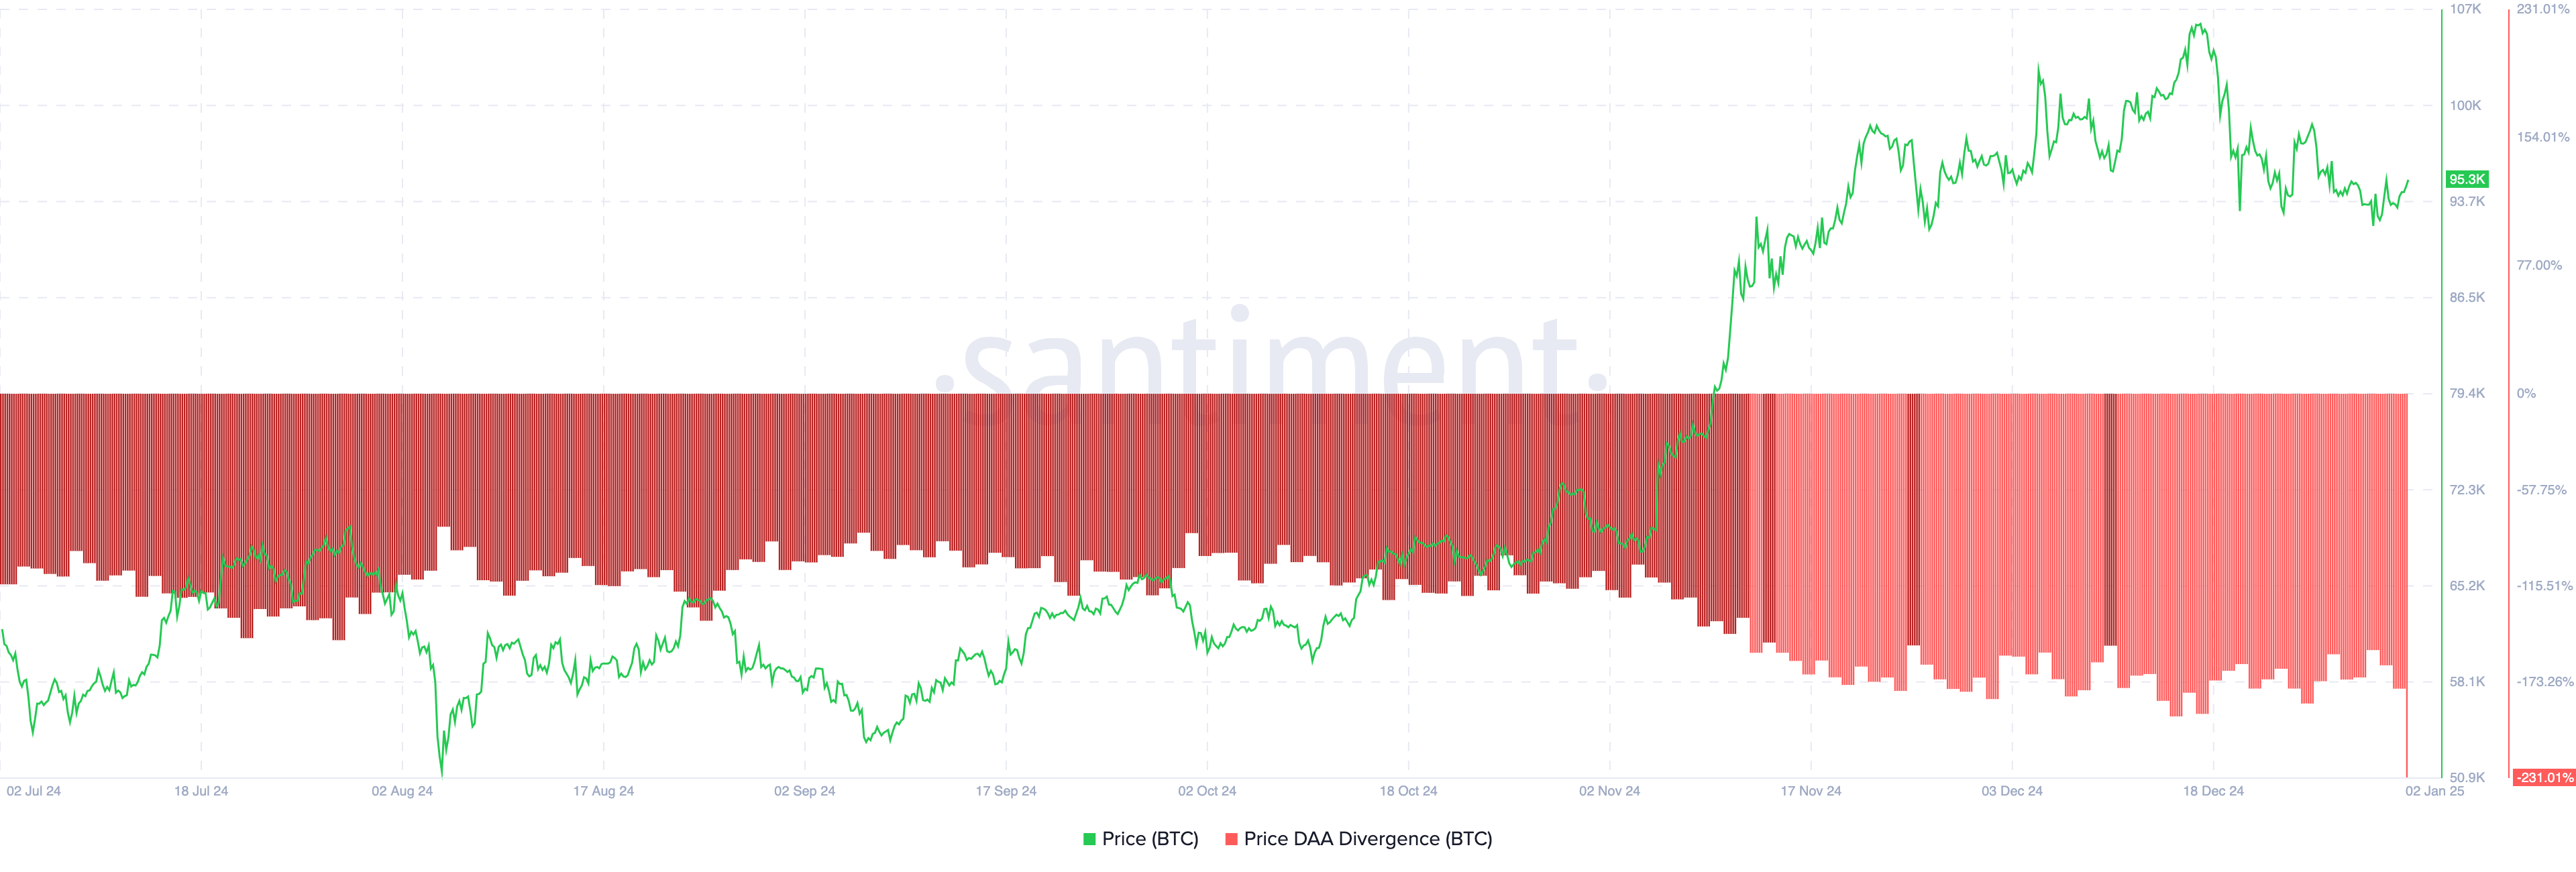
Another indicator that supports this outlook is the price — Daily Active Addresses (DAA) divergence. This metric measures the relationship between user engagement on a blockchain and the price action.
When it is positive, it implies that user participation has improved, which is bullish for the cryptocurrency. On the other hand, a negative reading indicates decreasing user engagement, which is, in turn, bearish.

As shown above, Bitcoin’s price DAA divergence is down to 231%, indicating the latter. If this trend persists, the likelihood of BTC trading below the $95,000 mark could grow even stronger.
BTC Price Prediction: Sub-$90,000 Levels Still Possible
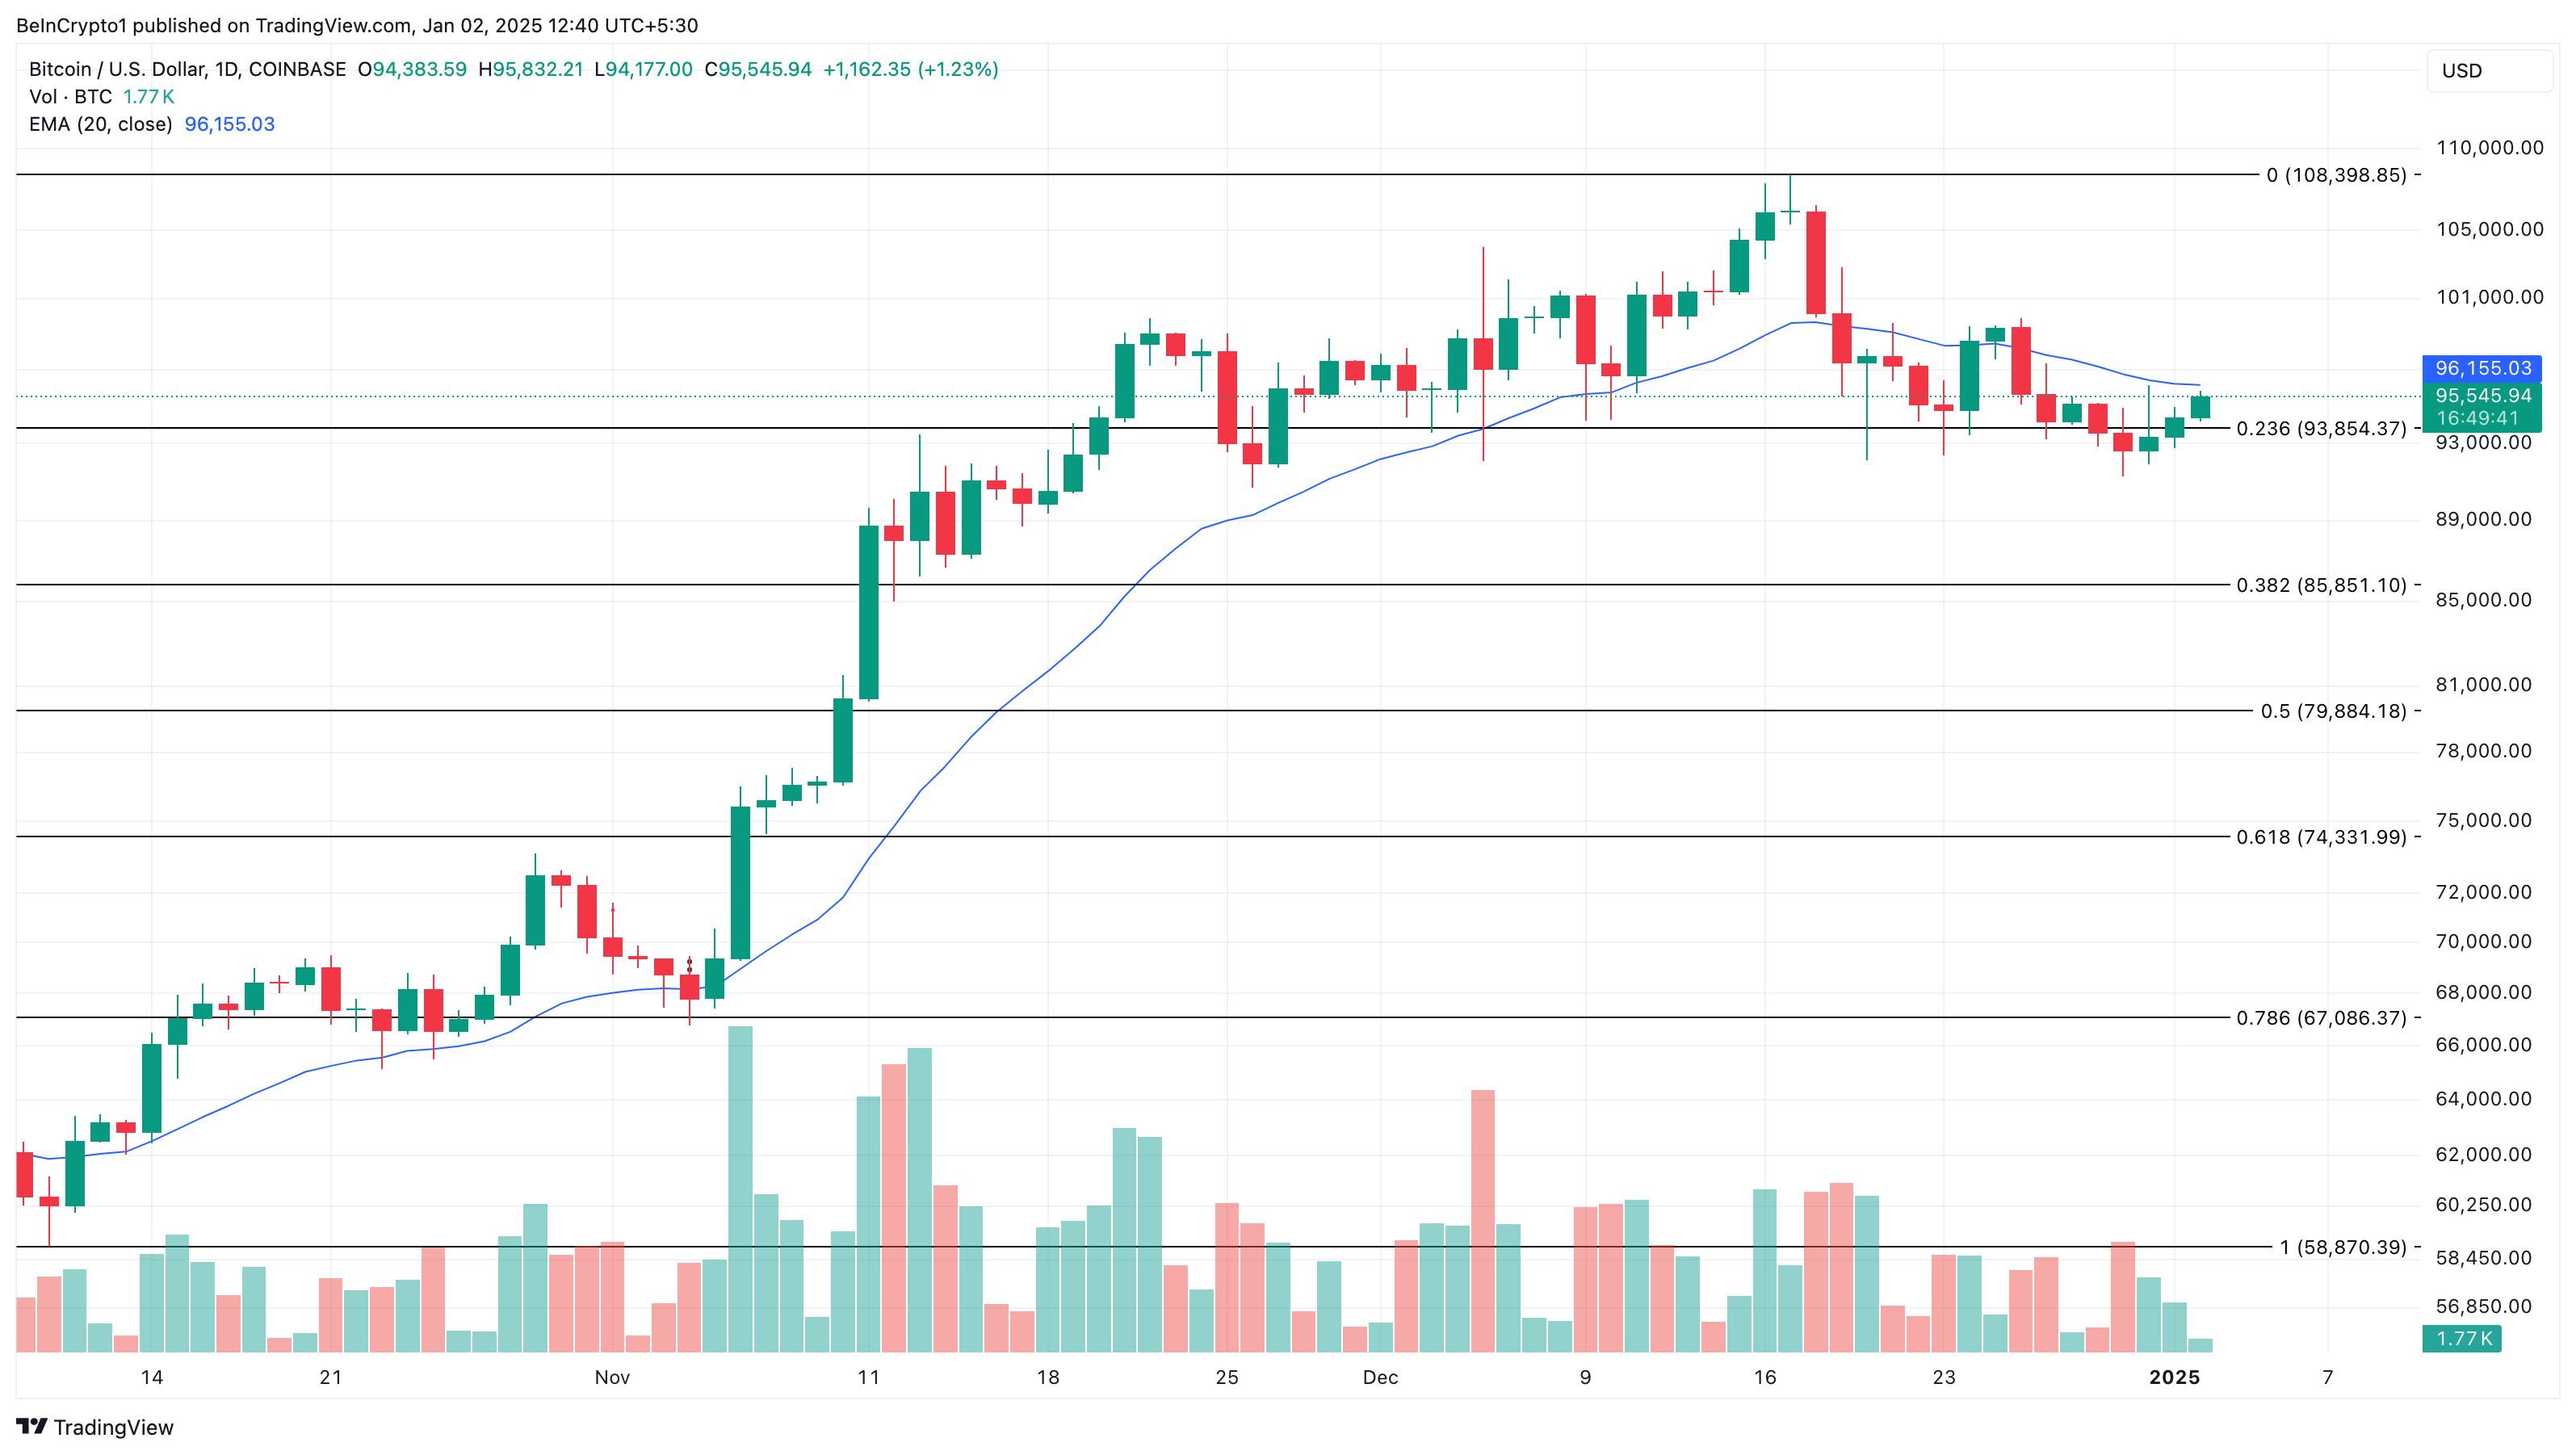
Even though BTC has recently increased, the Exponential Moving Average (EMA) suggests that the recent upswing might not last. The EMA is a technical indicator that gauges trend direction relative to the price.
When the EMA slopes above the price, the trend is bearish. But when the price is above the indicator, the trend is bullish. As of this writing, Bitcoin’s price is below 20 EMA (blue), suggesting that the value of cryptocurrency might continue to decline.

Should the crypto fail to rise above the 20 EMA and Bitcoin selling pressure increases, then the price might drop to $85,851. However, if US investors contribute to Bitcoin’s buying pressure, this trend might change. In that scenario, the coin’s value might jump to $108,398.

