
- Pepe has seen an 8% surge in the last week, with a 9% increase in the past 24 hours.
- Technical indicators like RSI and Awesome Oscillator suggest bearish sentiment, with PEPE’s price below key support levels despite investor profit booking.
The price of Pepe (PEPE) has experienced a bearish trend over the past 24 hours, fluctuating between an intra-day high of $0.00001176 and a low of $0.00001041. Pepe coin has experienced a notable 8% price surge in the last seven days, including a significant 9% increase in the past 24 hours. Despite initial hopes for a recovery, the prevailing bearish signals suggest that sustaining an upward trajectory remains challenging.
The Relative Strength Index (RSI) is currently trading just below the 50 level, indicating uncertainty in price momentum and an inability to confirm a trend reversal. Additionally, the Awesome Oscillator (AO) also supports this bearish sentiment. The AO remains below its mean level of zero, indicating that momentum continues to favor the bears.
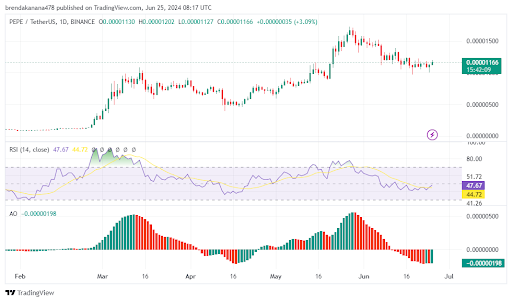
This aligns with the recent breach of PEPE’s ascending trendline support, a key technical level previously providing stability.
Profit Booking and Selling Pressure
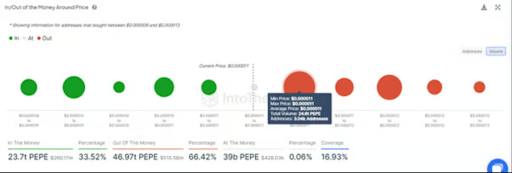
Investor behavior indicates increased profit booking, which contributes to the bearish trend. IntoTheBlock data shows that about 26% of active addresses holding PEPE tokens are profitable. This has led to heightened selling pressure as investors seek to capitalize on their gains, further hindering the price from bouncing back.
Additionally, 77.58% of PEPE holders remain profitable despite the recent downturn. A significant portion of these tokens was acquired in the $0.000002-$0.000003 range, where PEPE began its significant upward trajectory in late February. This historical context underscores the potential for a market rebound if sentiment improves.
The In/Out of the Money Map (IOMAP) reflects this selling pressure. Many addresses purchased PEPE at an average price of $0.0000110. If the price approaches this level, many investors may opt to sell to recover their initial investment, creating a significant resistance zone that could prevent upward momentum.
On-chain analysis reveals a decrease in network activity, which aligns with the bearish sentiment. The Daily Active Addresses index from Santiment shows a 24% drop in the last seven days, continuing a trend that began at the end of May. This decline indicates reduced interest and activity within the broader crypto community, suggesting fewer new entrants and decreased usage. This trend is concerning as sustained network activity is crucial for maintaining prices and encouraging recovery.
Critical Support and Resistance Levels
Despite the bearish indicators, PEPE’s price action near key support and resistance levels offers some hope. Currently, PEPE is marginally above a critical support line at $0.00001020. This level has been a battleground between bears and bulls, and its sustainability is crucial for PEPE’s short-term trajectory. If this support holds, PEPE could potentially recover recent losses, targeting resistance levels at $0.000013 and $0.000014.
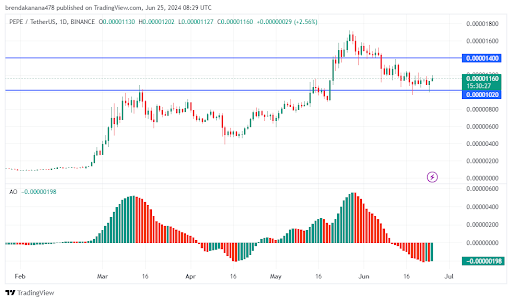
Conversely, a breakdown below this support could trigger a significant sell-off. The next key support level is around $0.00000870, and failure to maintain the current support could lead to a swift decline toward this lower threshold.
