Coins keep setting new local lows, according to CoinStats.
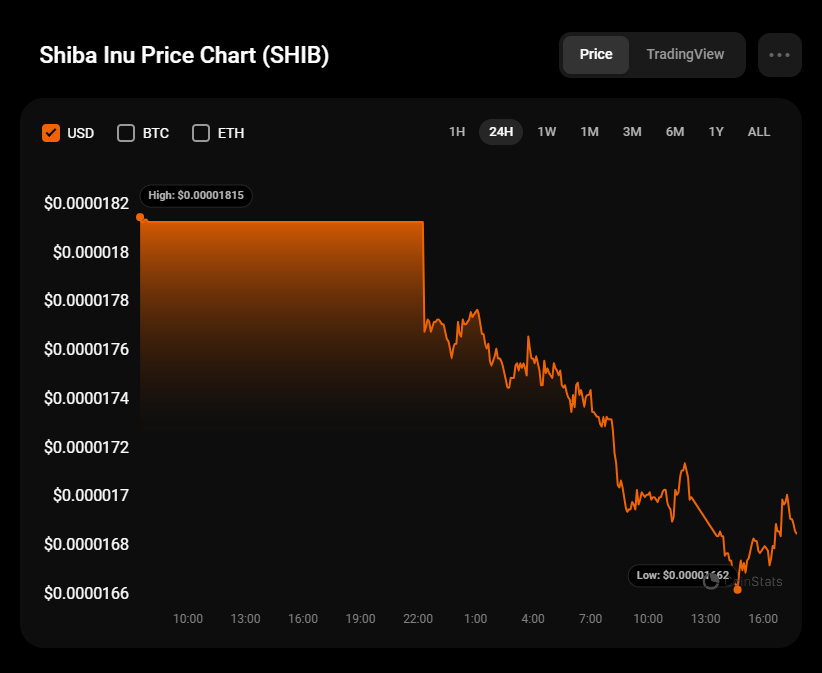
SHIB/USD
SHIB is no exception to the rule, going down by 5.44%.
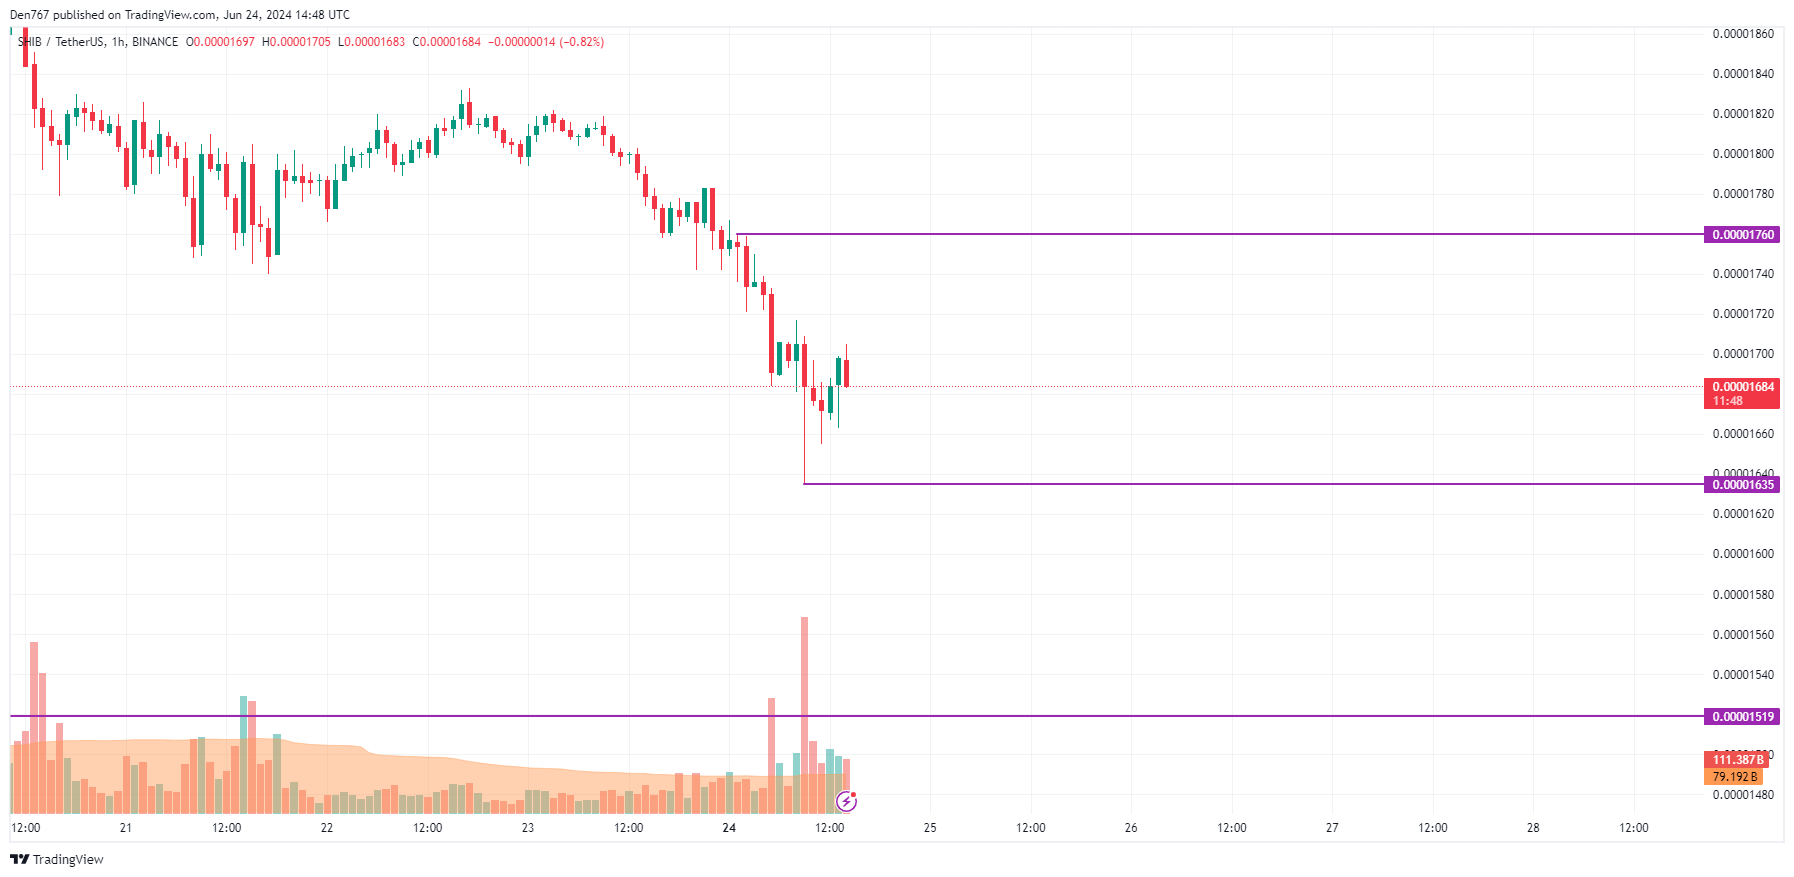
Despite today's fall, the price of SHIB is looking bearish on the local time frame. If the rate gets back to the support of $0.00001635, the accumulated energy might be enough for a breakout, followed by a move to the $0.000016 range.
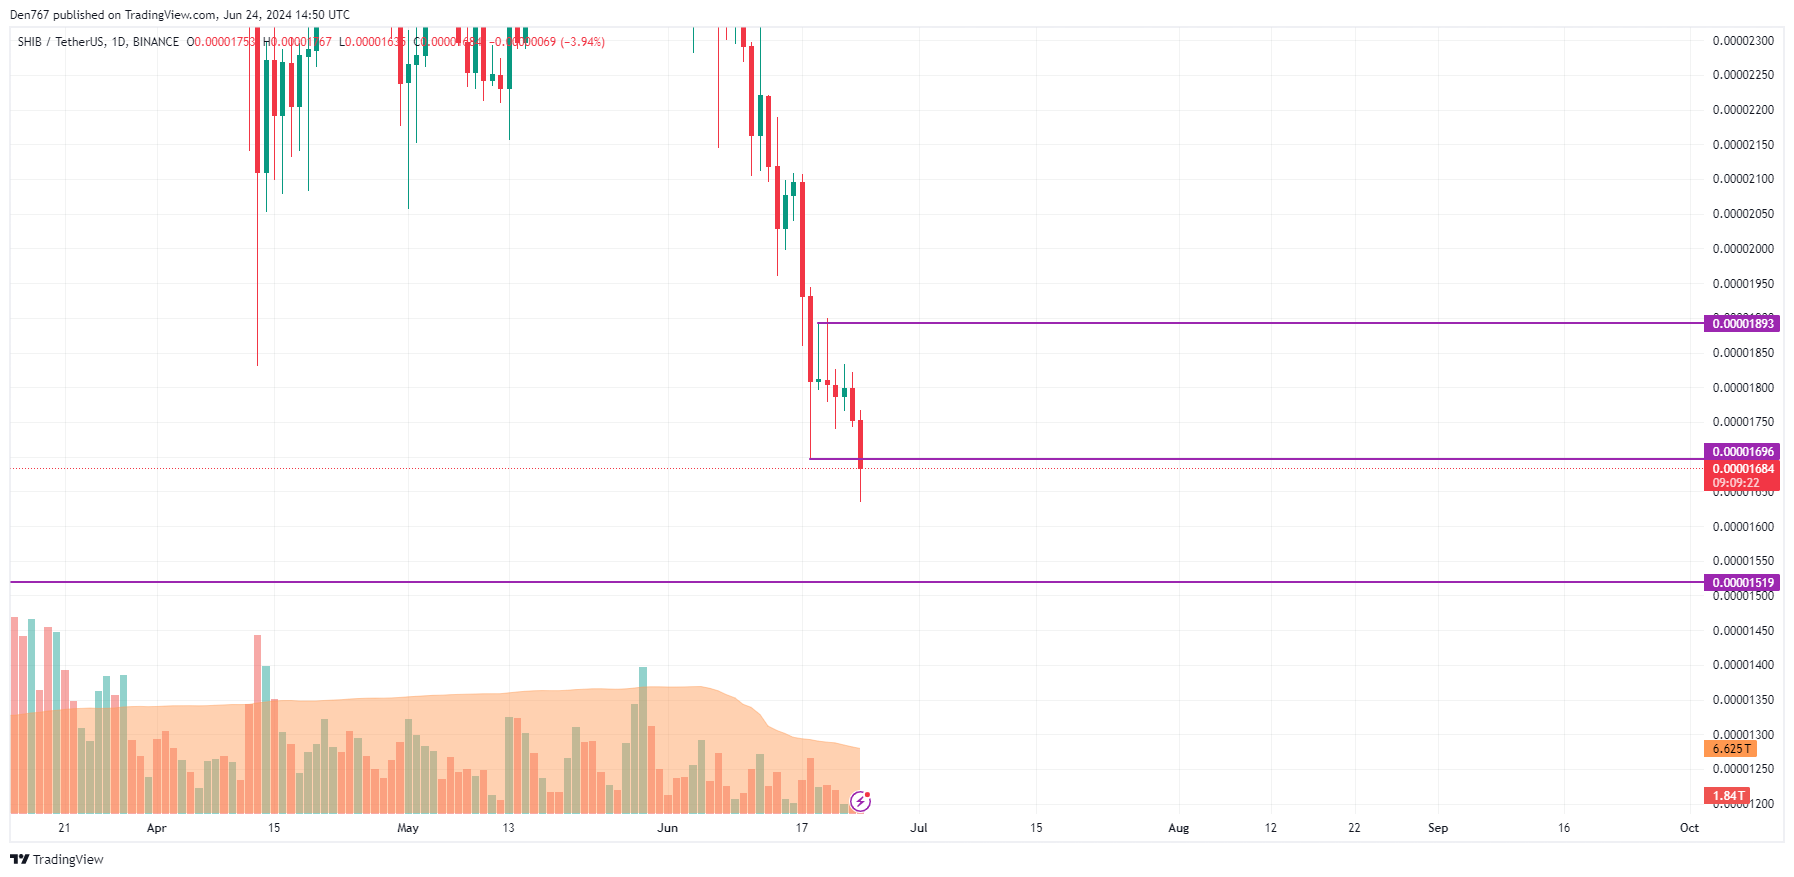
On the daily chart, one should pay attention to the bar's closure in terms of the interim support level of $0.00001696.
If the candle closes below it, the correction is likely to continue to $0.00001519.
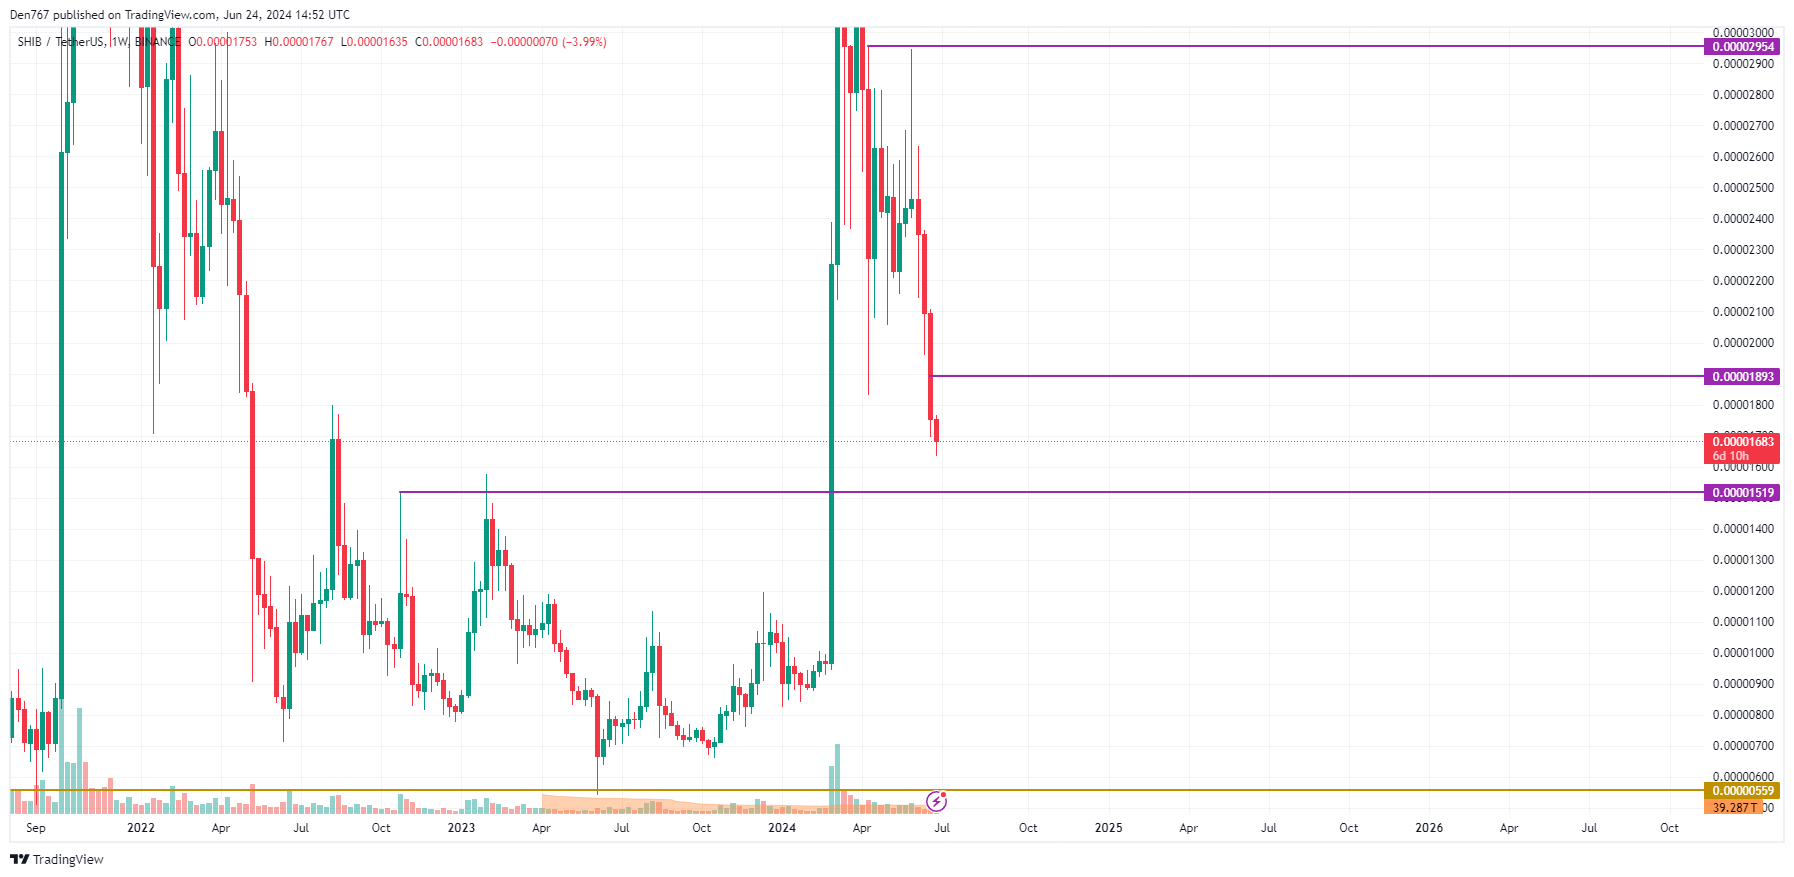
On the bigger time frame, the price of SHIB is far from the main levels. However, if the bar closes below the last candle low, one can expect a test of the $0.000015 range within the next few weeks.
SHIB is trading at $0.00001680 at press time.
