Ripple’s price has been consolidating for a couple of months, failing to reach its all-time high, unlike Bitcoin. Things might get even worse if the next critical level is lost.
By TradingRage
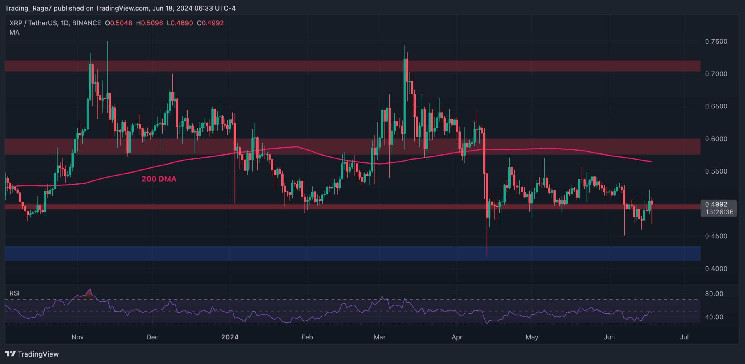
The USDT Paired Chart
On the XRP/USDT’s daily timeframe, the price has been trapped between the $0.5 and $0.55 mark since mid-April. Recently, the market has dropped below $0.5, but it is trying to reclaim the level now. If successful, a rally toward the 200-day moving average located around the $0.55 mark would be expected.
On the other hand, if the price is rejected, a decline toward $0.4 would be imminent. Moreover, if the $0.4 level is broken to the downside, things will likely get ugly for XRP, as a crash would be highly probable.
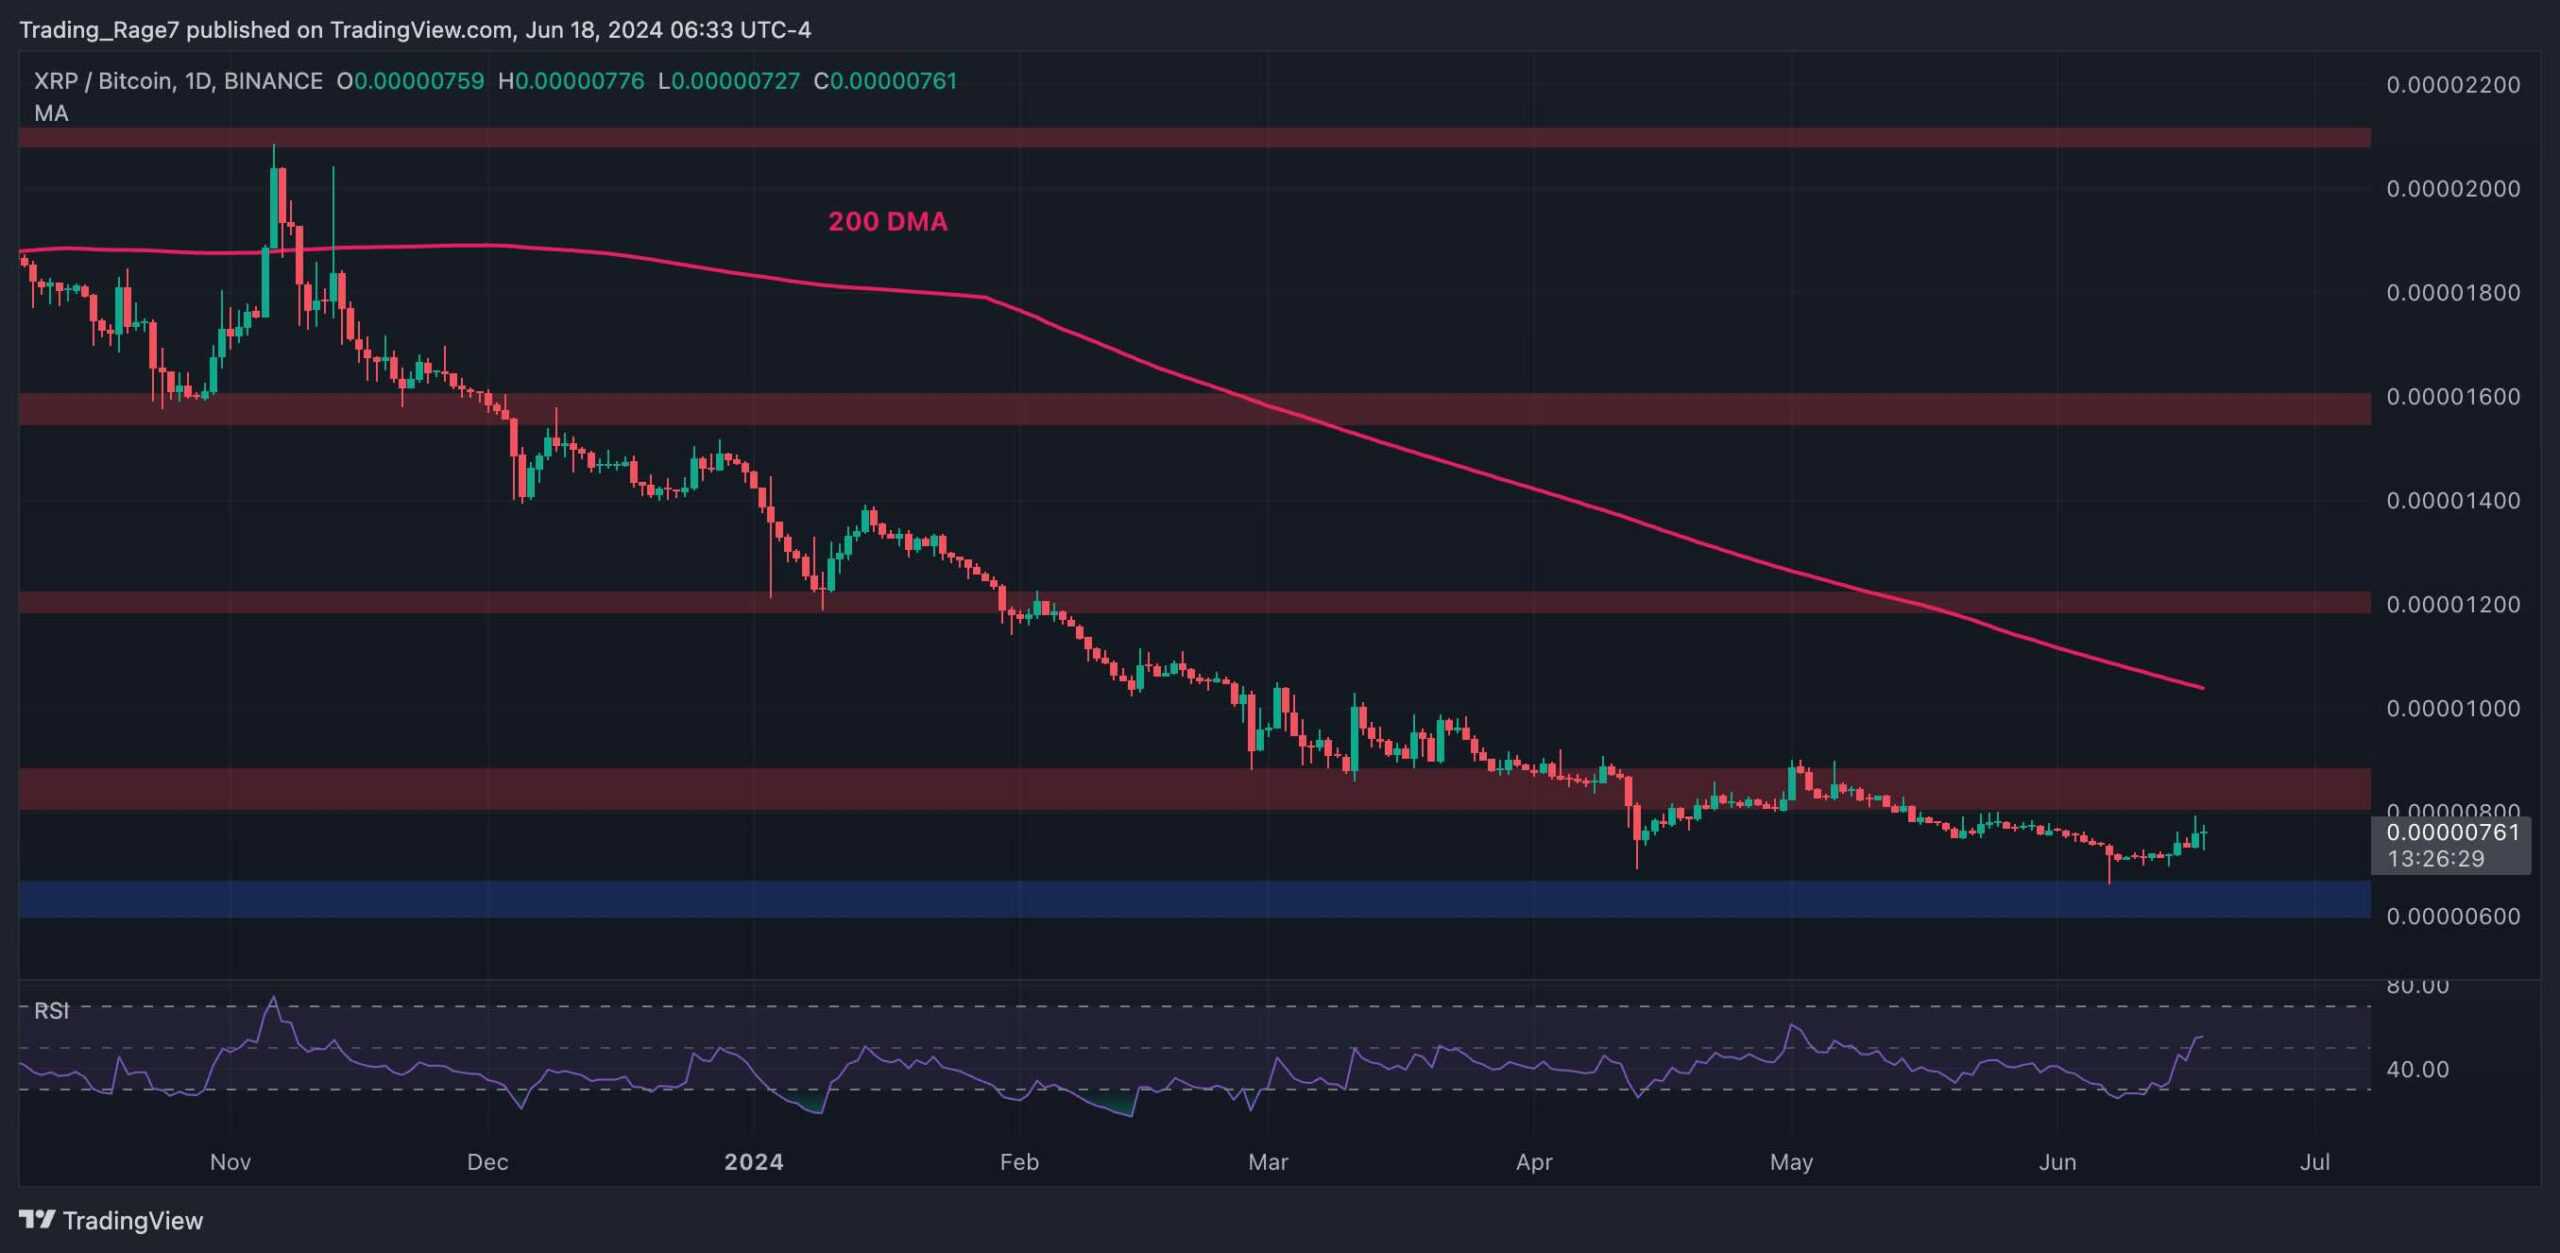
The BTC Paired Chart
The XRP/BTC pair looks the same, as the market is also consolidating between the 600 SAT and 800 SAT levels.
Meanwhile, the RSI has broken above 50%, indicating that the momentum is bullish again.
If the price can break above the 800 SAT resistance level, a further rise toward the 200-day moving average located around the 1000 SAT mark would be likely in the short term. On the contrary, a drop below the 600 SAT could lead to catastrophic consequences.