
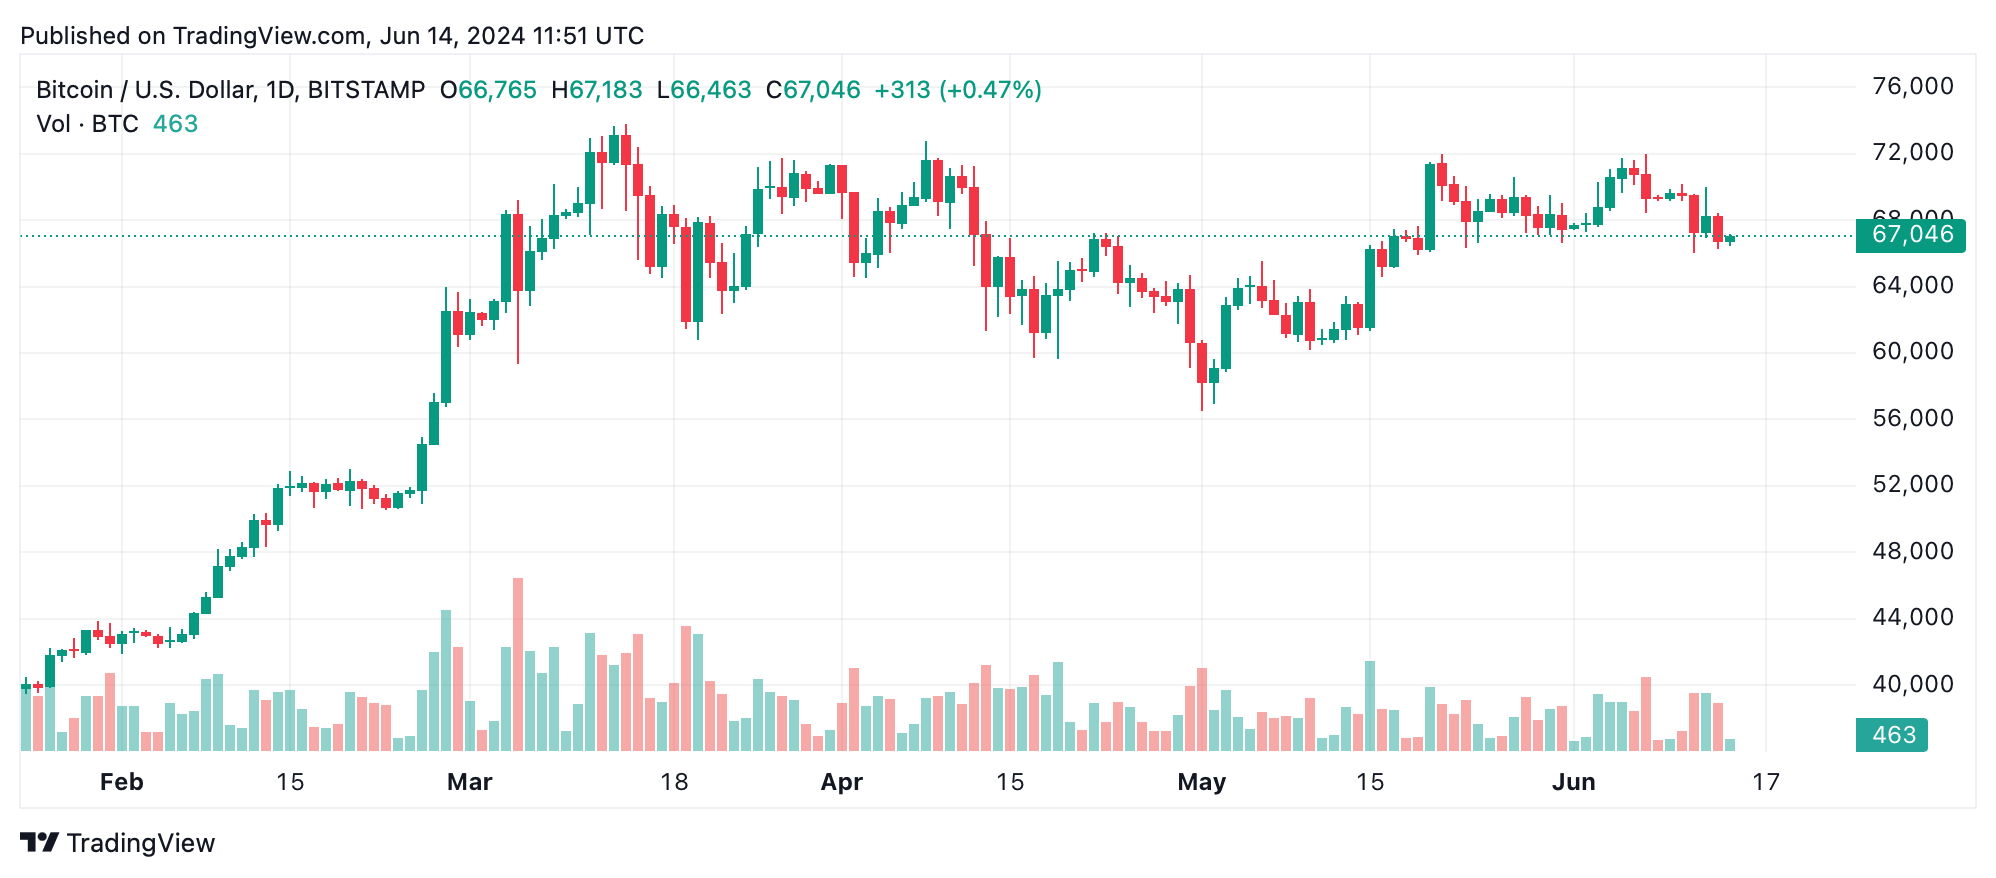
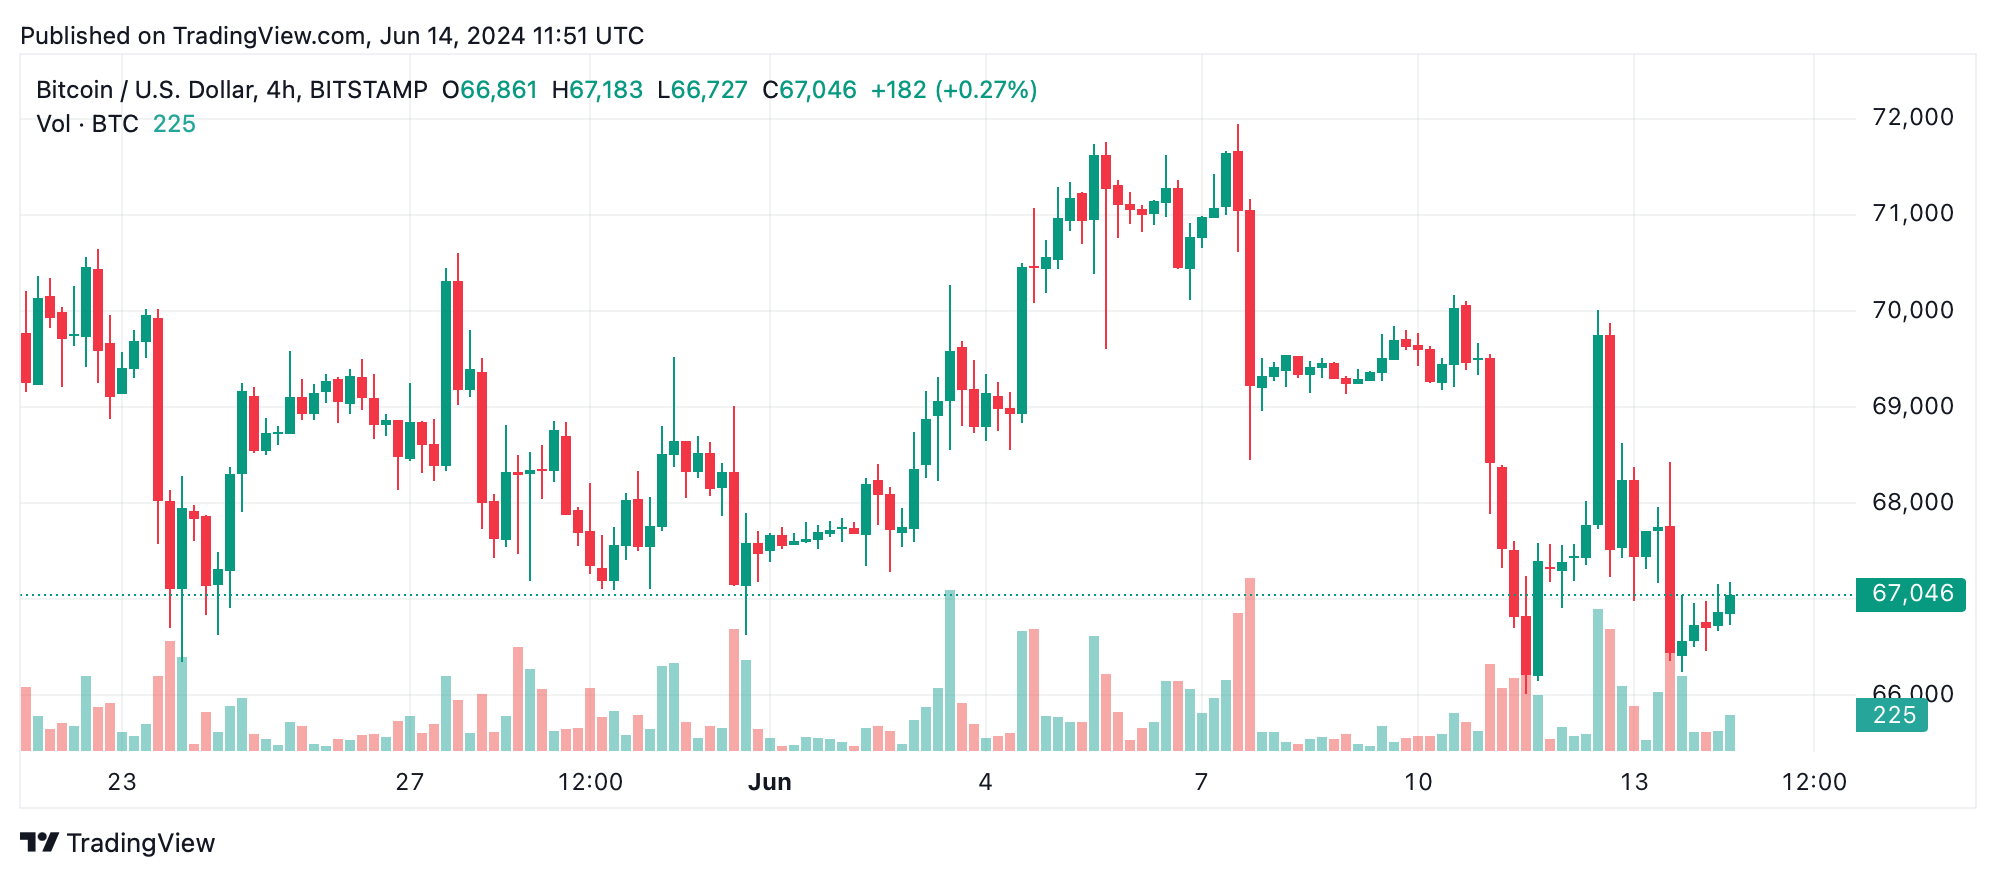
Bitcoin’s price on June 14, 2024, stands at $67,046, with intraday prices ranging from $66,425 to $68,506. The leading crypto asset’s market capitalization is $1.31 trillion, and the 24-hour trading volume is $23.92 billion. Technical analysis across multiple time frames indicates a prevailing downtrend, highlighting critical support and resistance levels for traders.
Bitcoin
Bitcoin’s hourly chart shows a general downtrend with minor consolidation. Key support is identified around $66,242, with resistance at $68,506. Volume spikes during major price movements indicate strong selling pressure. A potential entry point could be near the support level if there are signs of reversal or stabilization, while exits should be considered near resistance, especially if the price faces strong resistance.
The 4-hour chart also indicates a downtrend with lower highs and lower lows. Support on this chart is found around $66,011 and resistance at $70,167. Volume spikes suggest significant selling interest at higher levels. Traders might consider entering near the support level if the price shows signs of bottoming out and exiting near resistance if upward momentum stalls.
On the daily chart, the long-term trend continues to show a downtrend with pronounced swings. Support is around $66,000, while resistance is significantly higher at $71,958. Higher volumes on days with large price swings indicate strong market participation. Entry opportunities might present themselves near the support level if a consolidation or reversal pattern emerges, with exits planned around the higher resistance level.
Oscillators provide a mixed picture. The relative strength index (RSI) at 45, Stochastic at 21, commodity channel index (CCI) at -130, and the average directional index (ADX) at 19 all indicate a neutral stance. However, the momentum oscillator at -3713 and moving average convergence divergence (MACD) level at 277 both suggest a bearish signal, reinforcing the overall negative sentiment.
Moving averages (MAs) further solidify this bearish outlook. The exponential moving averages (EMA) and simple moving averages (SMA) for 10, 20, and 30 periods indicate a sell signal, with prices well below these averages. Only the 50, 100, and 200-period EMAs and SMAs suggest a buy signal, indicating potential long-term support levels.
Bull Verdict:
Despite the current downtrend, long-term support levels indicated by the 50, 100, and 200-period moving averages suggest that bitcoin may find strong buying interest around these levels. If the price consolidates and forms a reversal pattern near these supports, a bullish trend could emerge, targeting the higher resistance levels.
Bear Verdict:
The prevailing downtrend across multiple time frames, coupled with bearish signals from key oscillators and shorter-term moving averages, points to continued downward pressure. Traders should exercise caution, as the momentum and MACD indicators suggest further declines, with immediate support levels being critical to watch for potential breakdowns.
