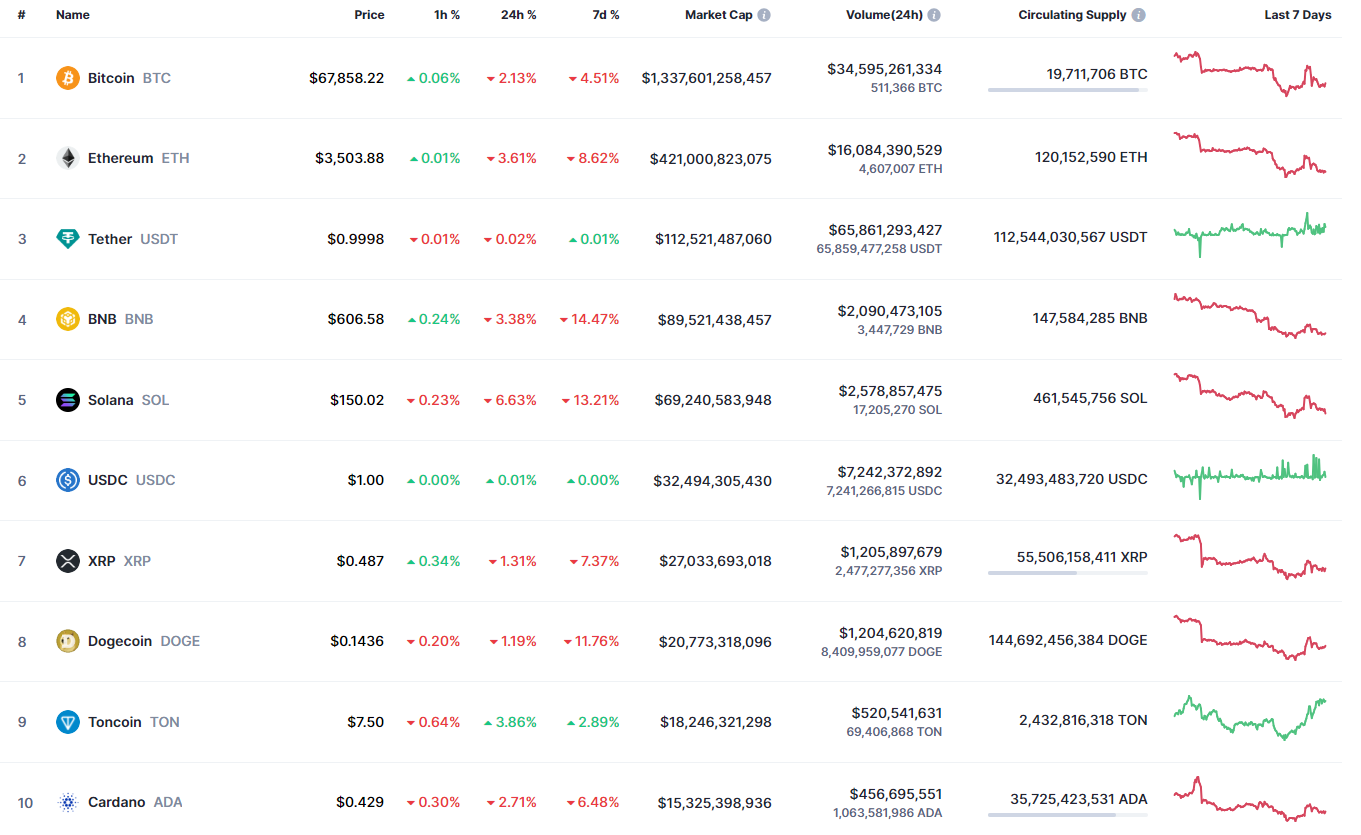
After a slight bounce back, the price of most of the coins keep going down, according to CoinMarketCap.
SHIB/USD
The rate of SHIB has fallen by 4.56% over the last day.
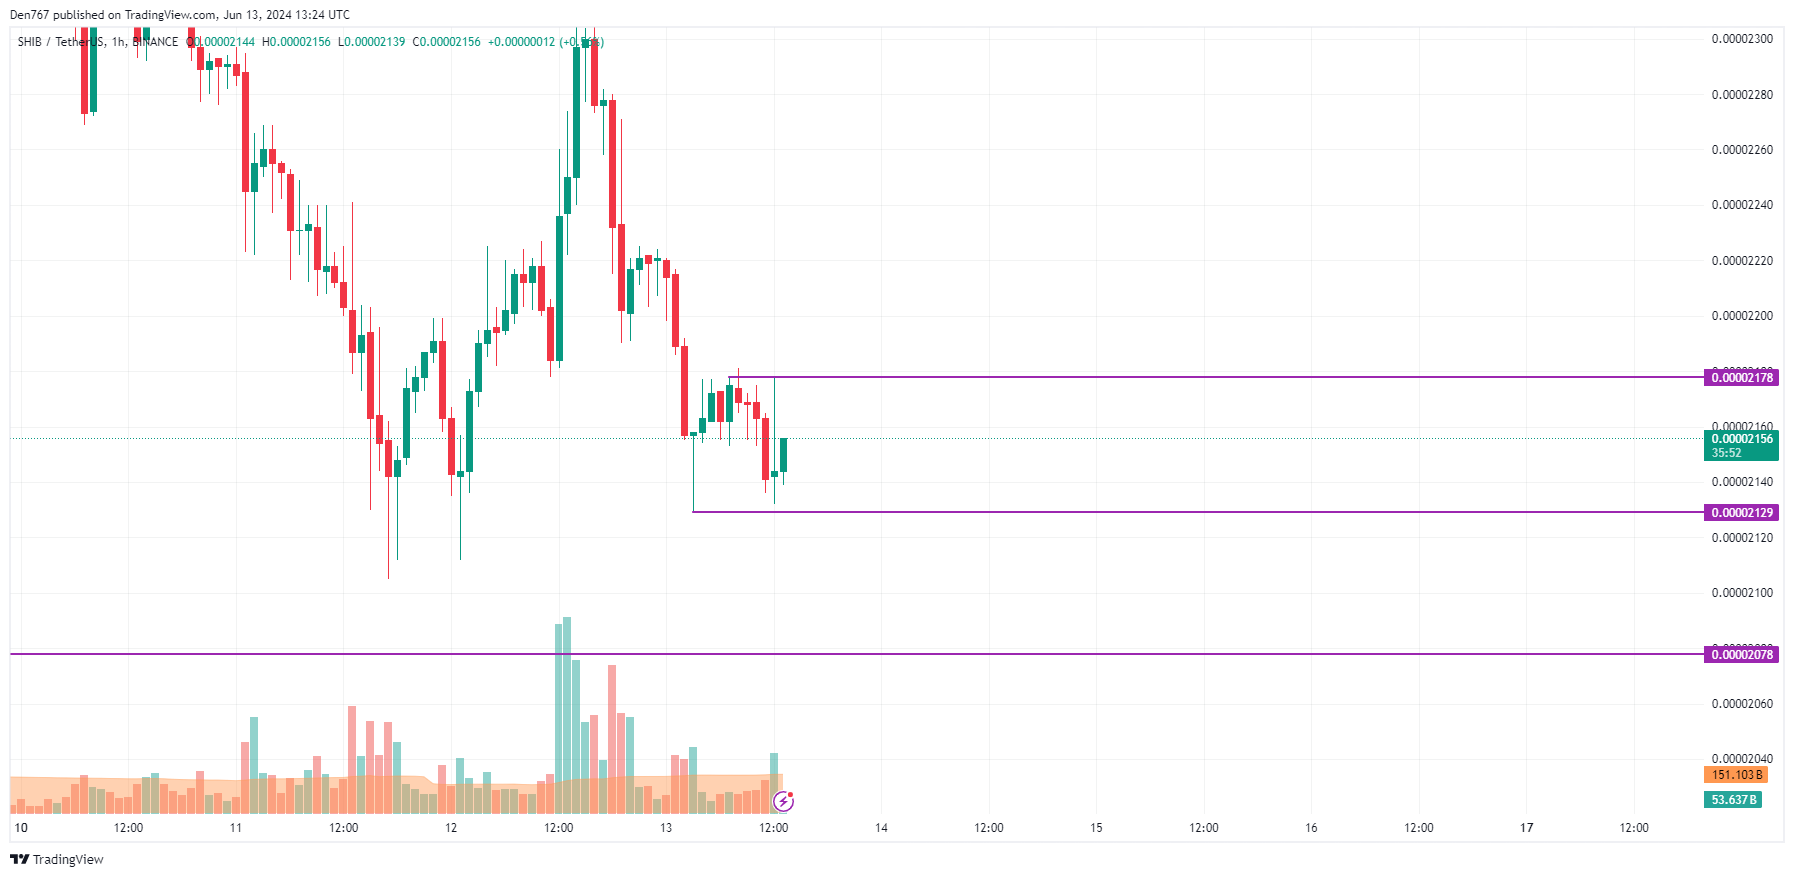
On the hourly chart, the price of SHIB is in the middle of the local channel.
However, if the upward move continues to the upper line, one can expect a breakout, followed by a move to the $0.0000222 zone.
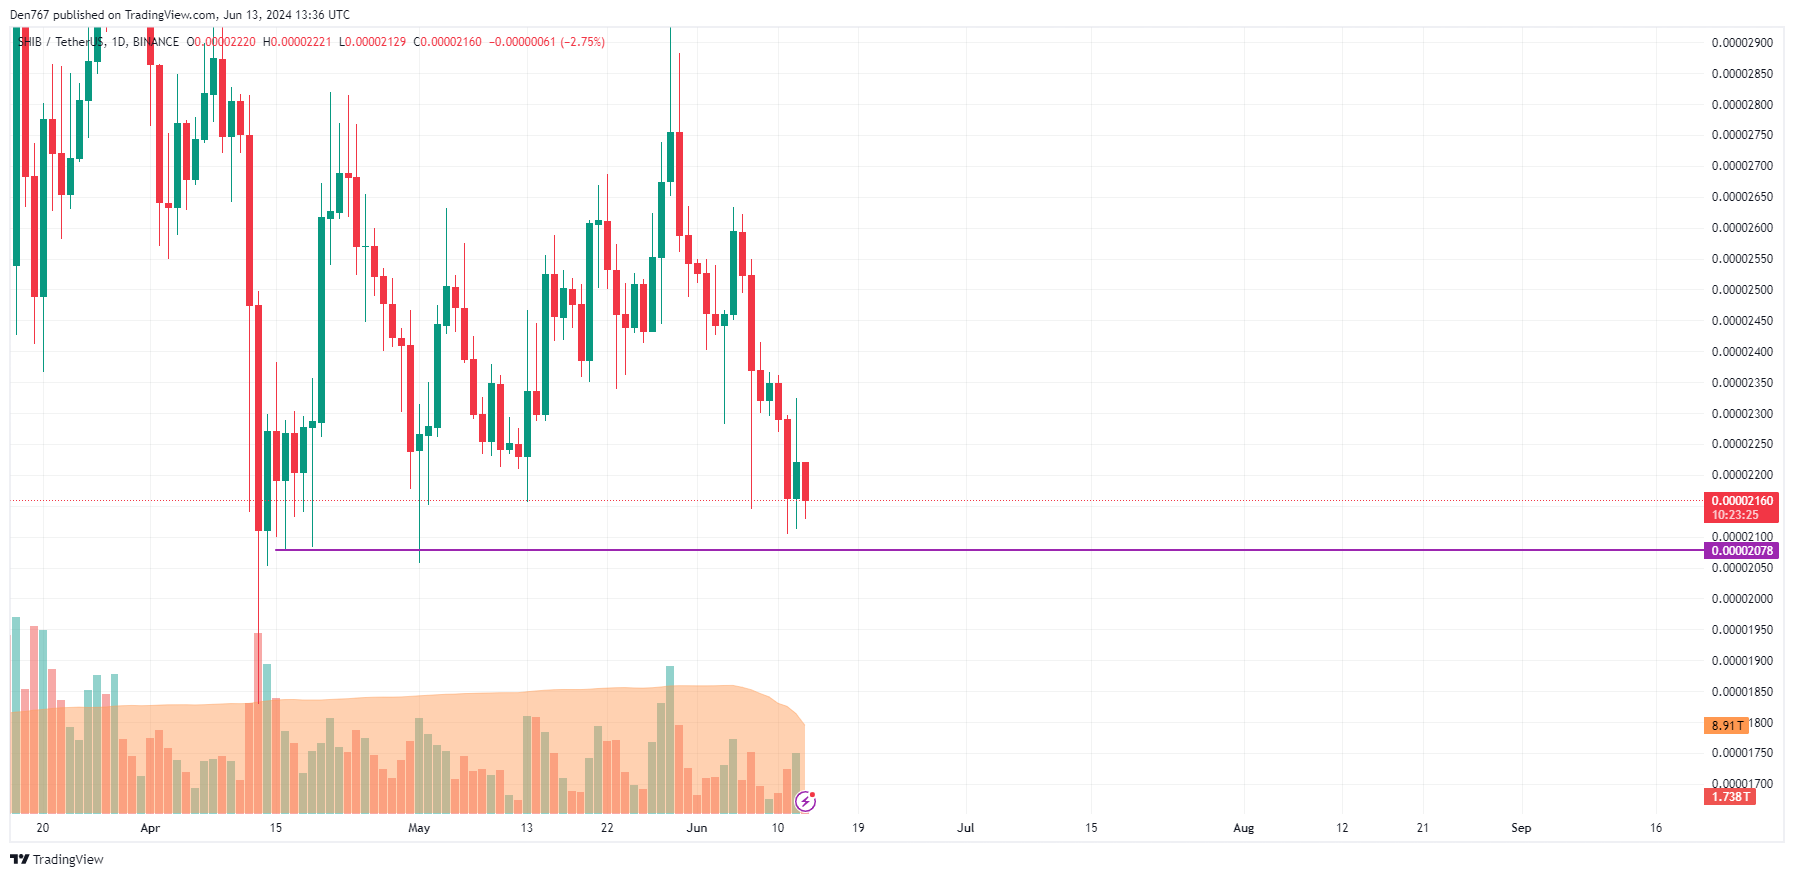
On the bigger time frame, the rate of SHIB is coming back to the support level of $0.00002078. If its breakout occurs, the accumulated energy might be enough for a more profound drop to $0.000020.
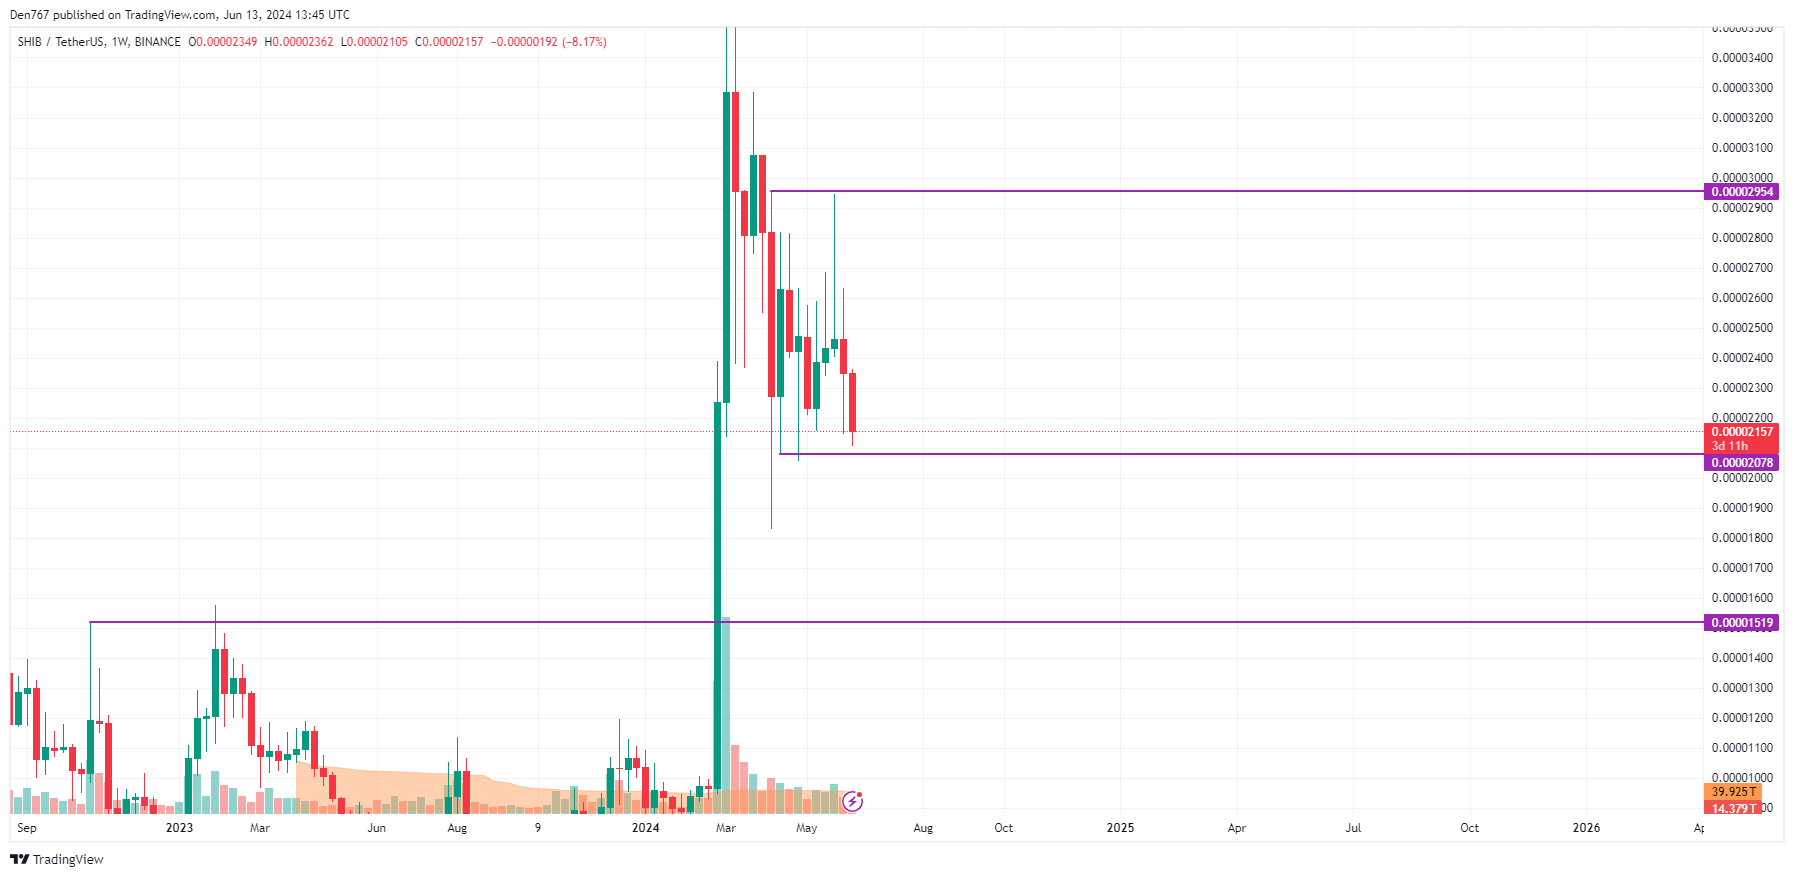
A similar picture can be seen on the weekly chart. If the candle closes around current prices, traders may witness a test of the $0.000018 zone soon.
SHIB is trading at $0.00002157 at press time.
