Sellers keep their pressure on the last day of the week, according to CoinMarketCap.
SHIB/USD
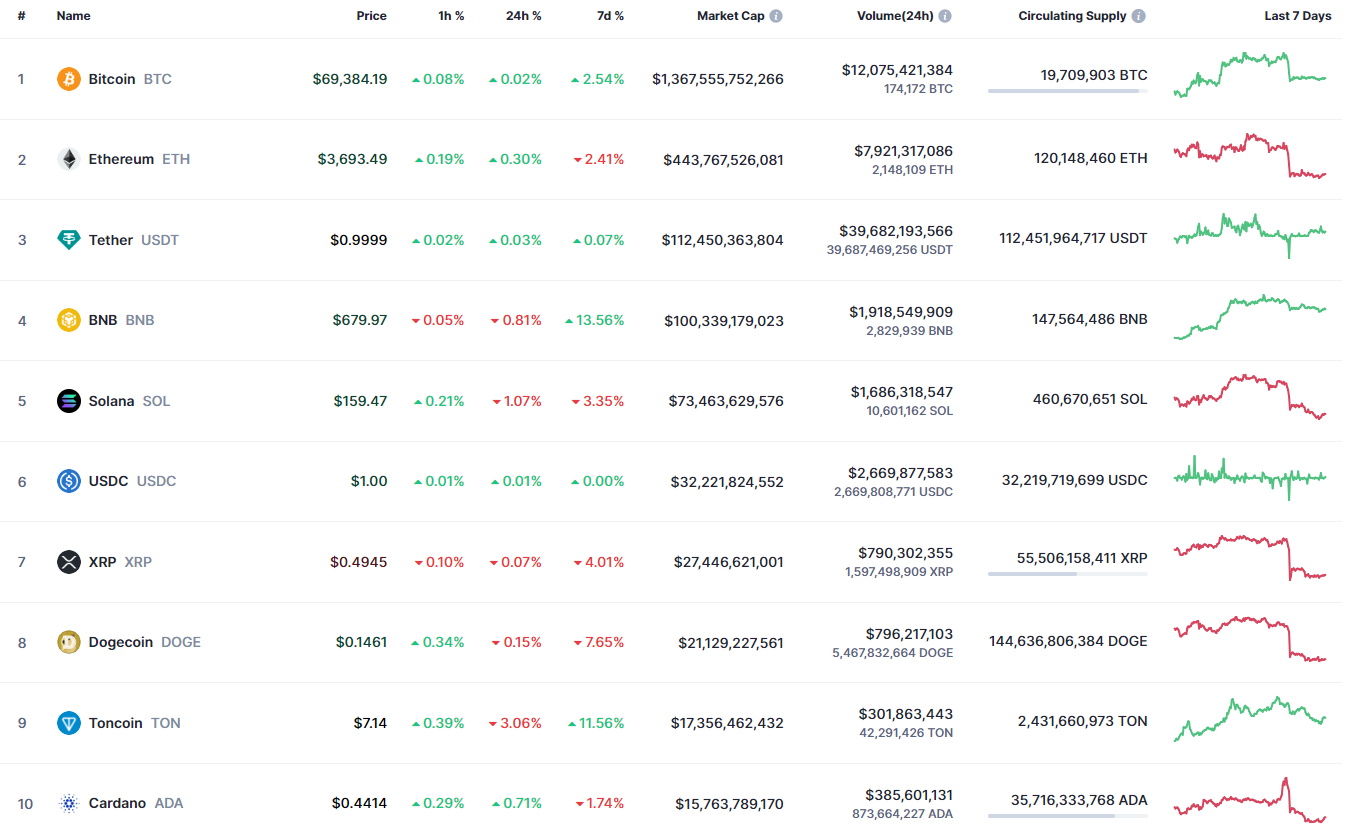
The rate of SHIB has fallen by 1.68% since yesterday. Over the last week, the price has fallen by 6.88%.
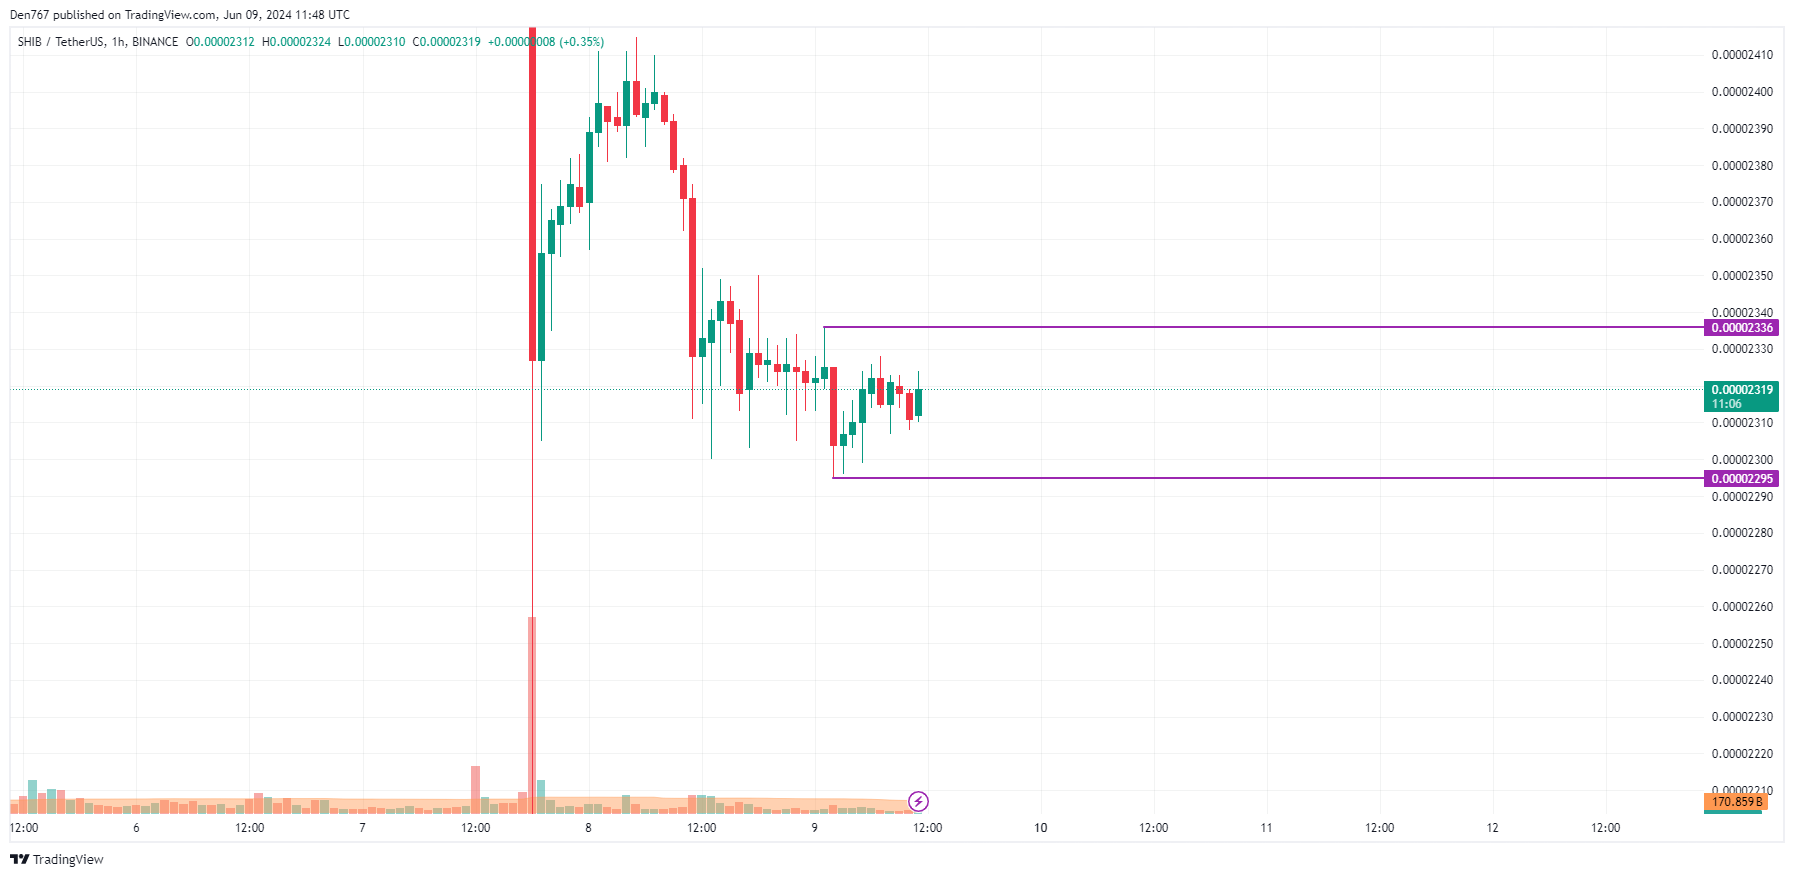
On the hourly chart, the rate of the altcoin is in the middle of the local channel. However, if the price reaches the $0.00002330 mark, there is a chance of a resistance breakout, followed by a move to the $0.00002360 zone.
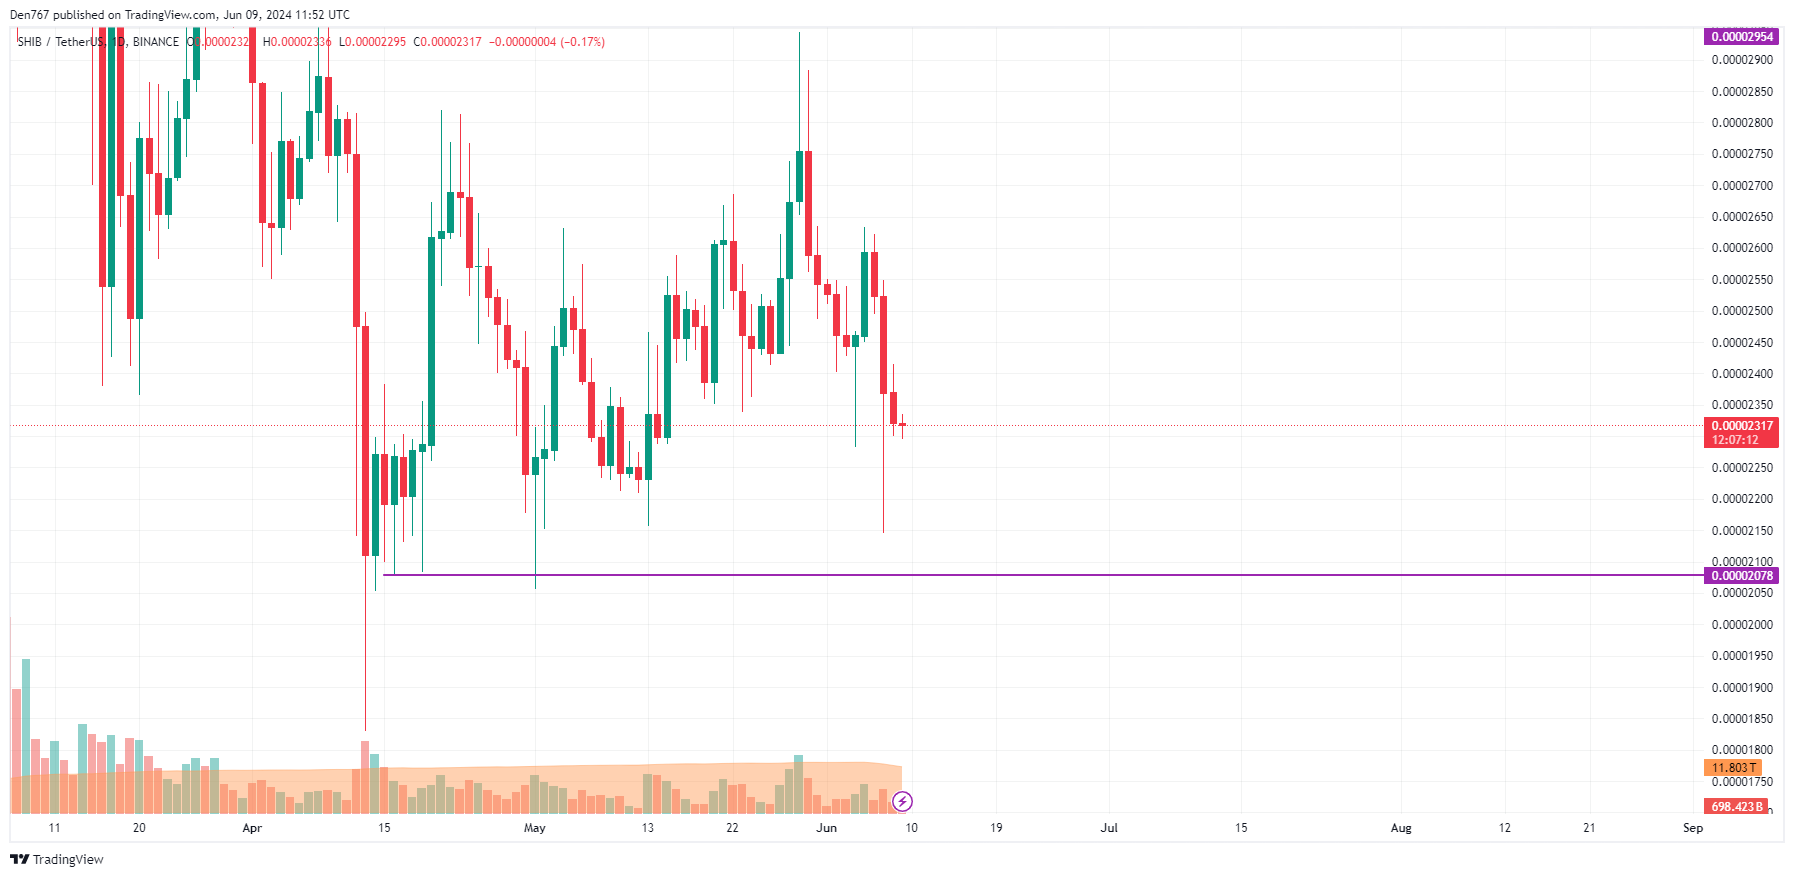
On the daily chart, traders should pay attention to the interim level of $0.000023. If the bar closes below it and with no long wick, the decline is likely to continue to the $0.000022 range the upcoming week.
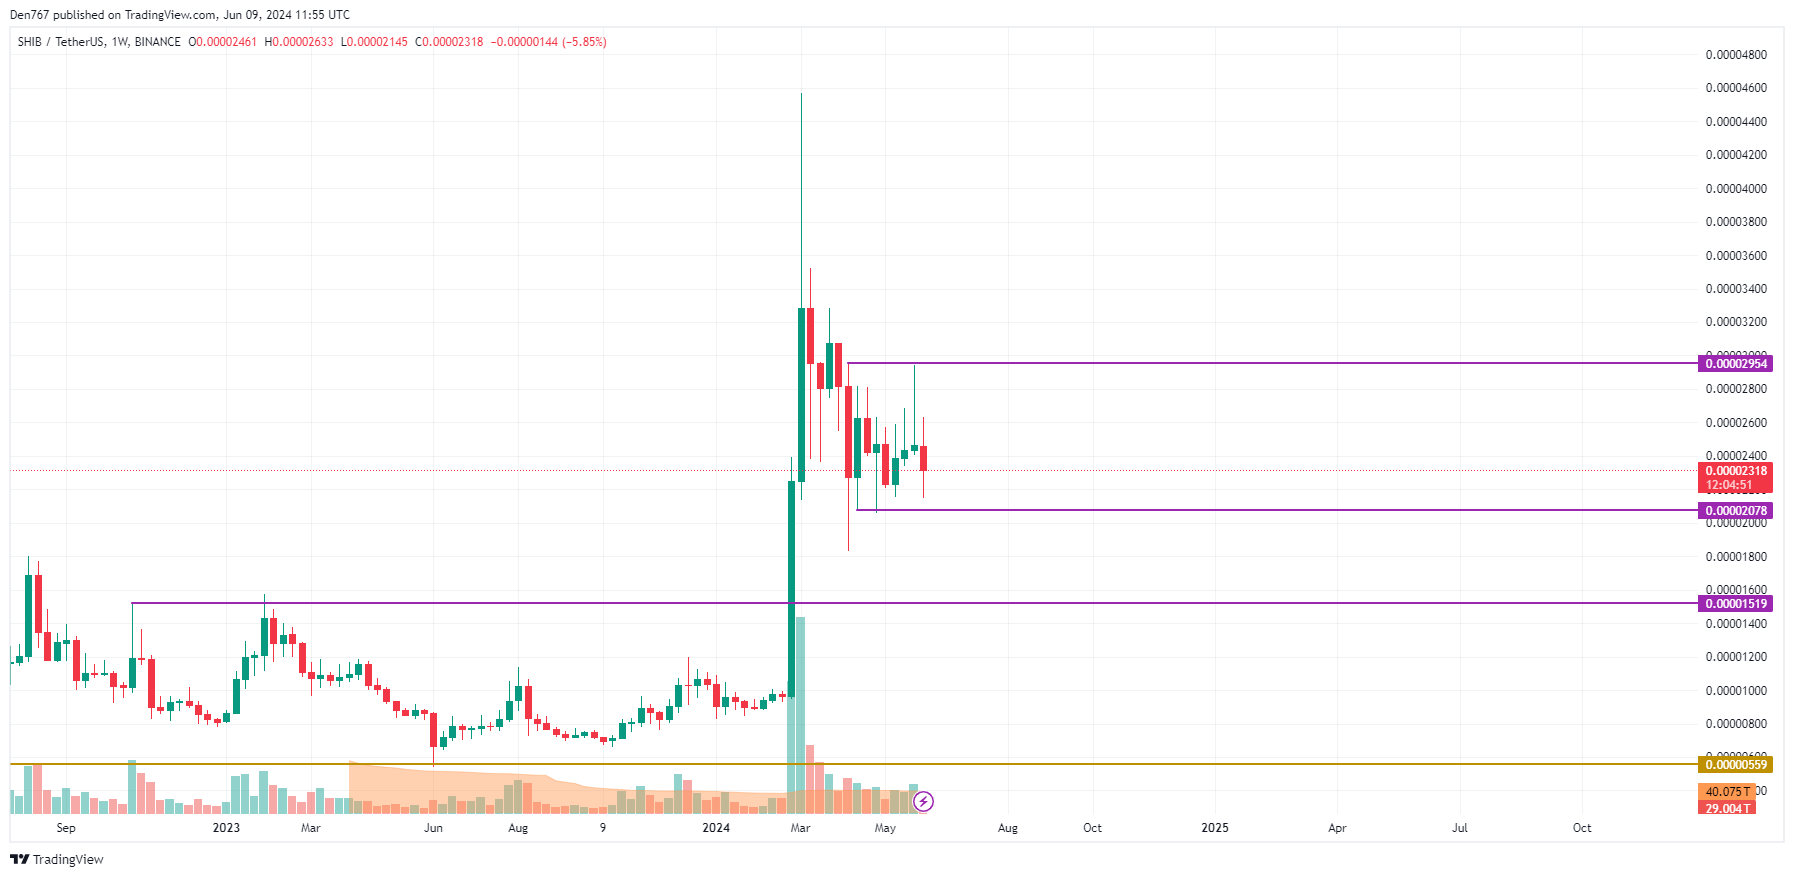
From the midterm point of view, the price of SHIB is closer to the support than to the resistance.
If bears' pressure continues, the accumulated energy might be enough for a breakout of the $0.00002078 level, followed by a profound drop to $0.000018.
SHIB is trading at $0.00002317 at press time.
